
Suppose you expect to sell 100 units next month at 20 each. That is a revenue forecast of 2,000. If you simply type 2,000 into a plan, the assumption disappears. If you keep units and price separate, a colleague can ask the useful question: are we expecting more customers, a higher price or both?
Good sales forecast Excel templates make those assumptions easy to inspect. The five free files here use different approaches: monthly growth, product economics, weighted opportunities, seasonal allocation and forecast-versus-actual review. They have distinct layouts and colors, with editable formulas and previews of the actual workbooks.
Choose a method that matches how sales happen
A repeat-revenue business may begin with the previous month and an explicit growth assumption. A retailer or manufacturer often benefits from units multiplied by price. A consultancy with a small number of large opportunities may need a weighted pipeline. A seasonal business might first agree an annual plan and then allocate it to months using its trading pattern.
These methods answer different questions. Do not add a full product forecast to a full pipeline forecast if both include the same expected sale. Choose an owning model for each revenue stream and make any combination deliberate. Keep the forecast horizon, currency and recognition basis consistent before comparing totals.
Separate a sales target from a forecast. The target expresses what the business wants to achieve. The forecast expresses what the current assumptions support. Keeping both visible can reveal the additional volume, pricing or conversion work required to close a gap without disguising an aspiration as an established expectation.
Download the forecast that fits your sales process
1. Monthly Growth Sales Forecast
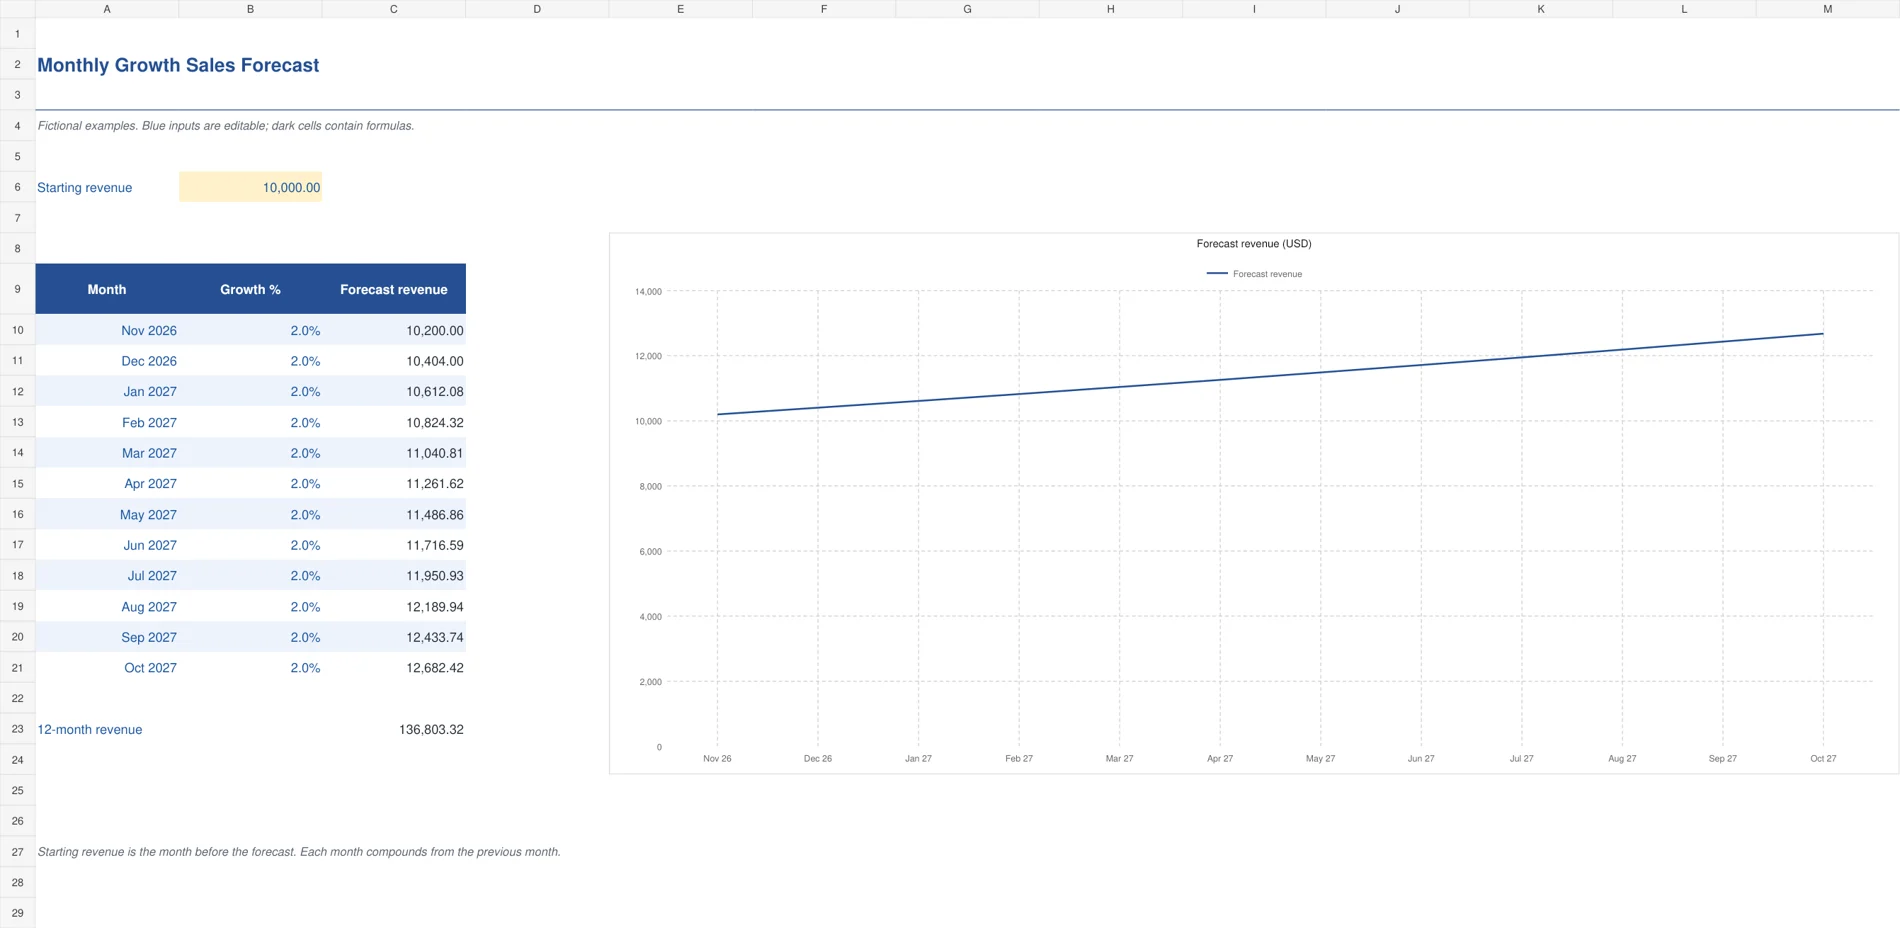
This indigo forecast is a compact starting point for a business with a reasonably stable revenue base. Enter revenue for the month immediately before the forecast and a growth assumption for each of the next twelve months. Every month compounds from the preceding month. A formula-linked line chart helps you see the shape of the resulting plan, while the detail remains available beside it.
The sample starts at 10,000 and applies 2% growth to the first month, producing 10,200. Changing that month to 10% produces 11,000 and also affects later months through the same forecast chain. Enter separate monthly assumptions where conditions differ. The model is useful for making a growth assumption visible; it does not independently establish that customers will generate the forecast revenue.
2. Product Sales Forecast
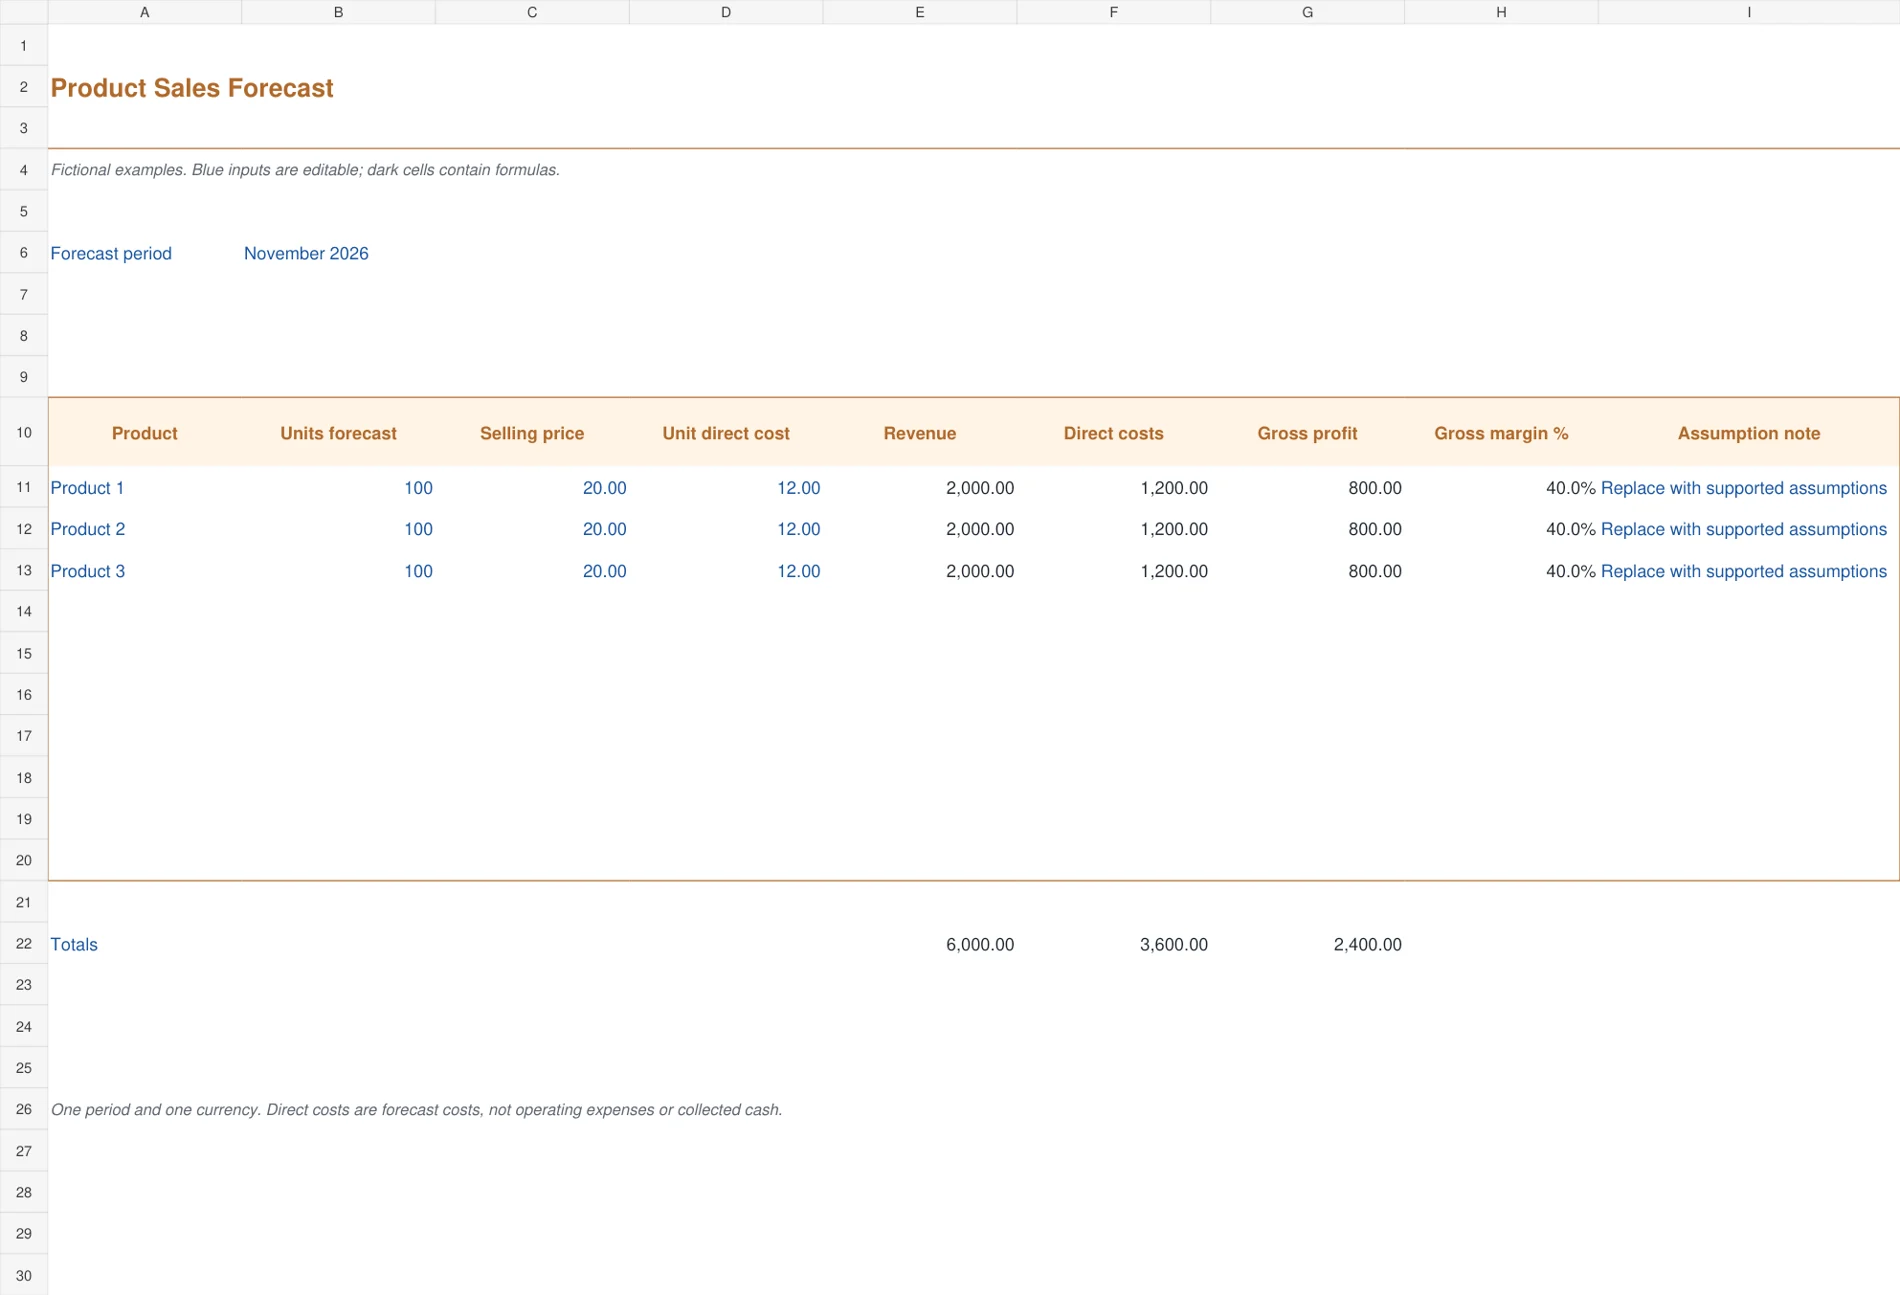
The ochre product worksheet builds one period’s revenue from forecast units and selling price. Unit direct cost produces forecast direct costs, gross profit and gross margin. This is useful when products have different economics or a change in volume needs to be separated from a change in price. Totals roll up the revenue, direct cost and gross profit across the ten available product rows.
Use one consistent period and currency. At 100 units, a selling price of 20 and direct cost of 12, the sample produces revenue of 2,000 and gross profit of 800. Increasing units to 150 raises gross profit to 1,200 with the other inputs unchanged. Operating expenses, tax and cash collection timing are outside this focused calculation and should be planned separately.
3. Weighted Pipeline Forecast
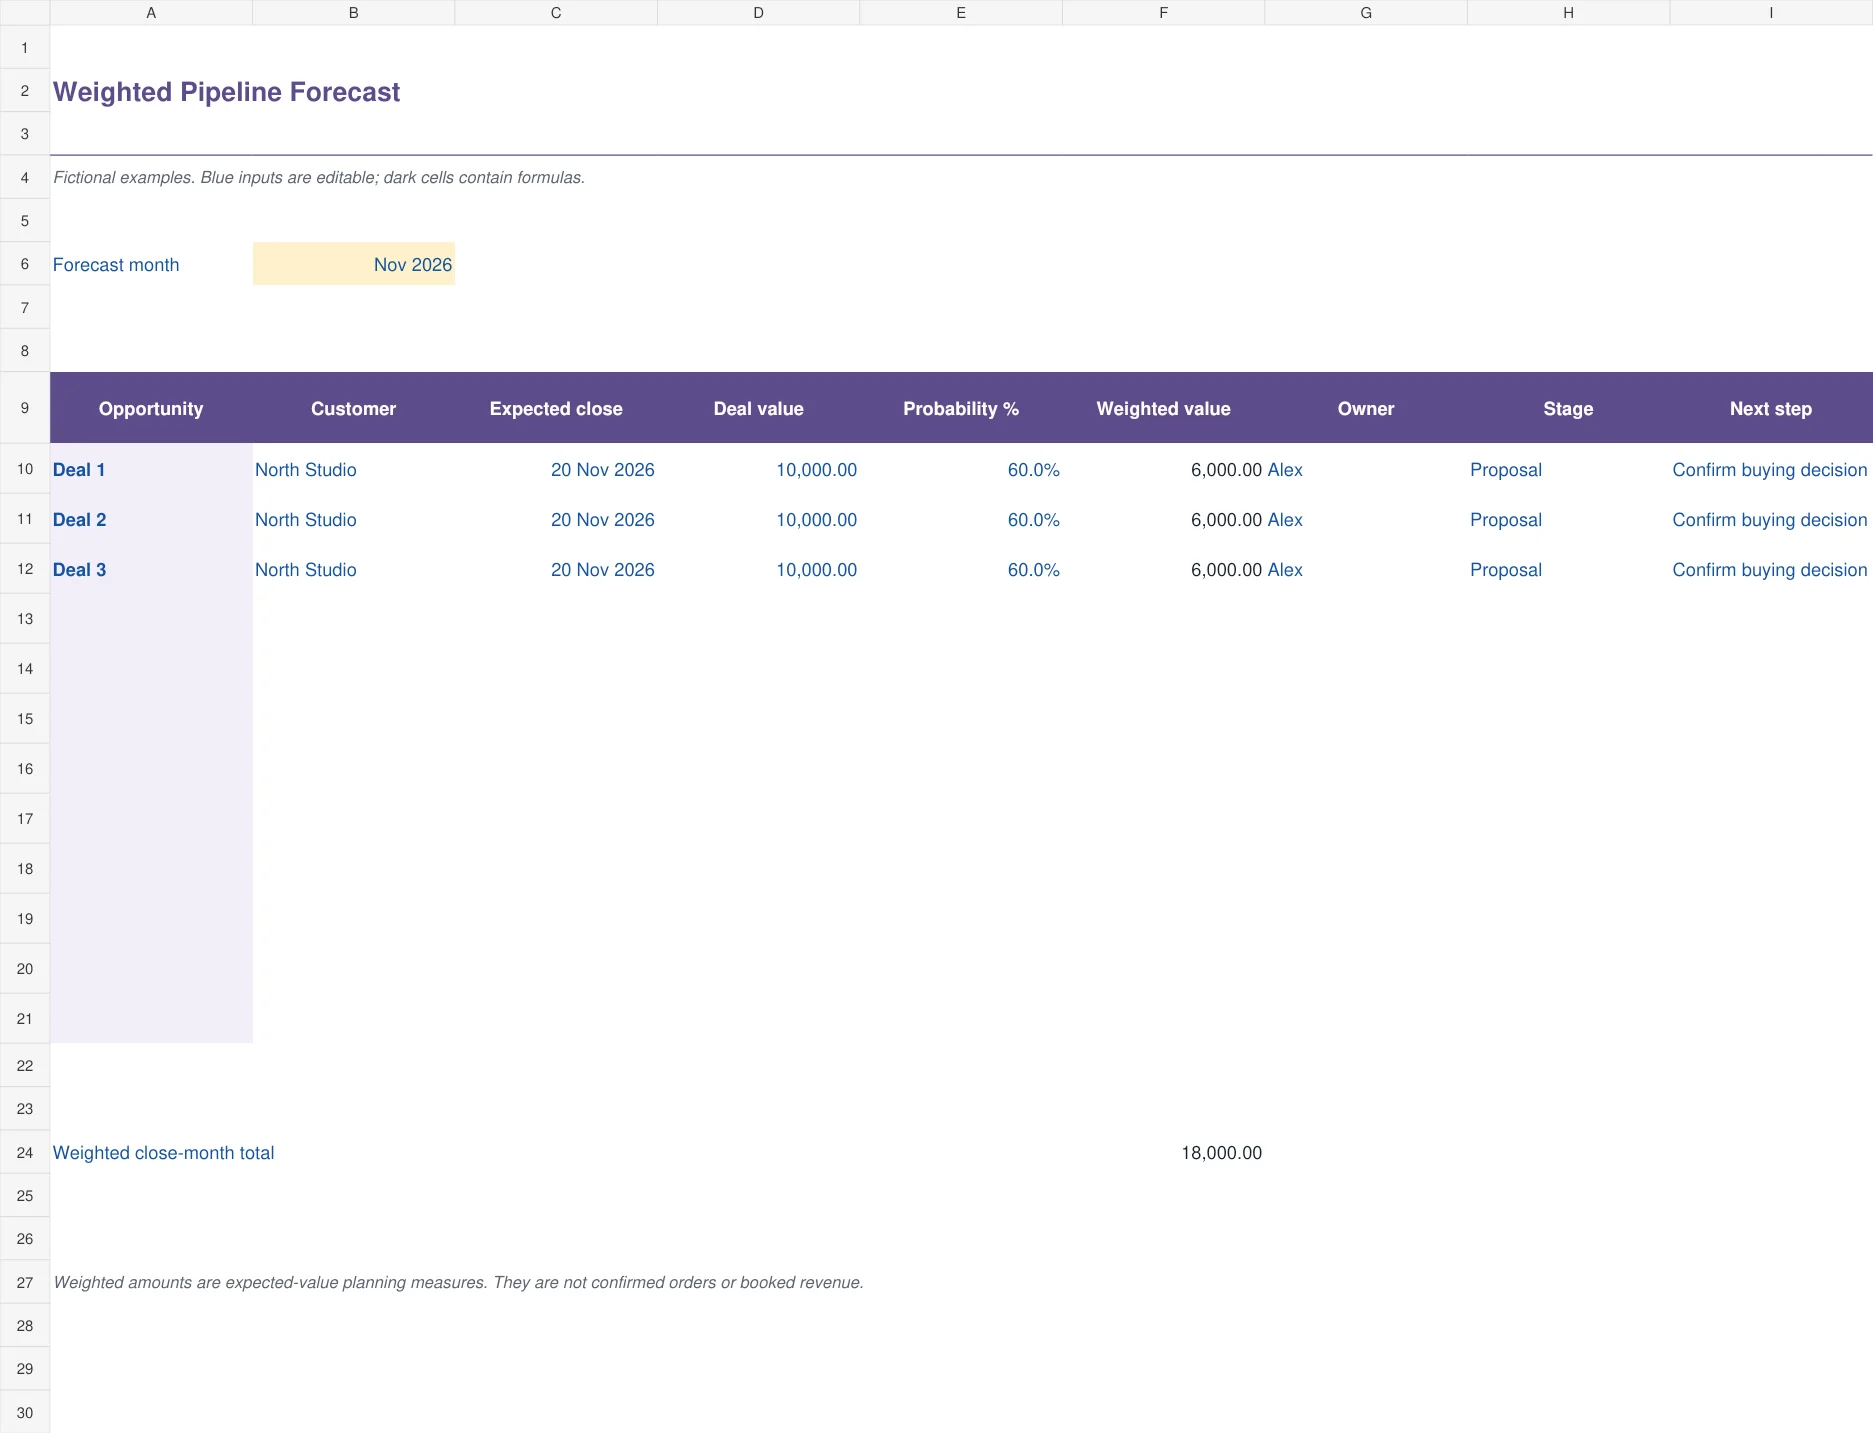
The violet pipeline forecast applies an entered probability to each opportunity value and totals weighted values for the selected expected-close month. Customer, owner, stage and next step remain visible beside the amount. The layout suits a business that sells through identifiable opportunities and needs to distinguish potential deals from a confirmed order book. Probability is an assumption to review, not a guarantee attached to a sales stage.
Enter the expected close date as a real date and choose the forecast month in the control cell. A 10,000 opportunity at 60% contributes 6,000 to the weighted amount. Reducing that probability to 30% contributes 3,000. The month total includes only rows whose expected close falls within the selected calendar month. Moving a close date can therefore change the forecast even when the deal value is unchanged.
4. Seasonal Sales Forecast
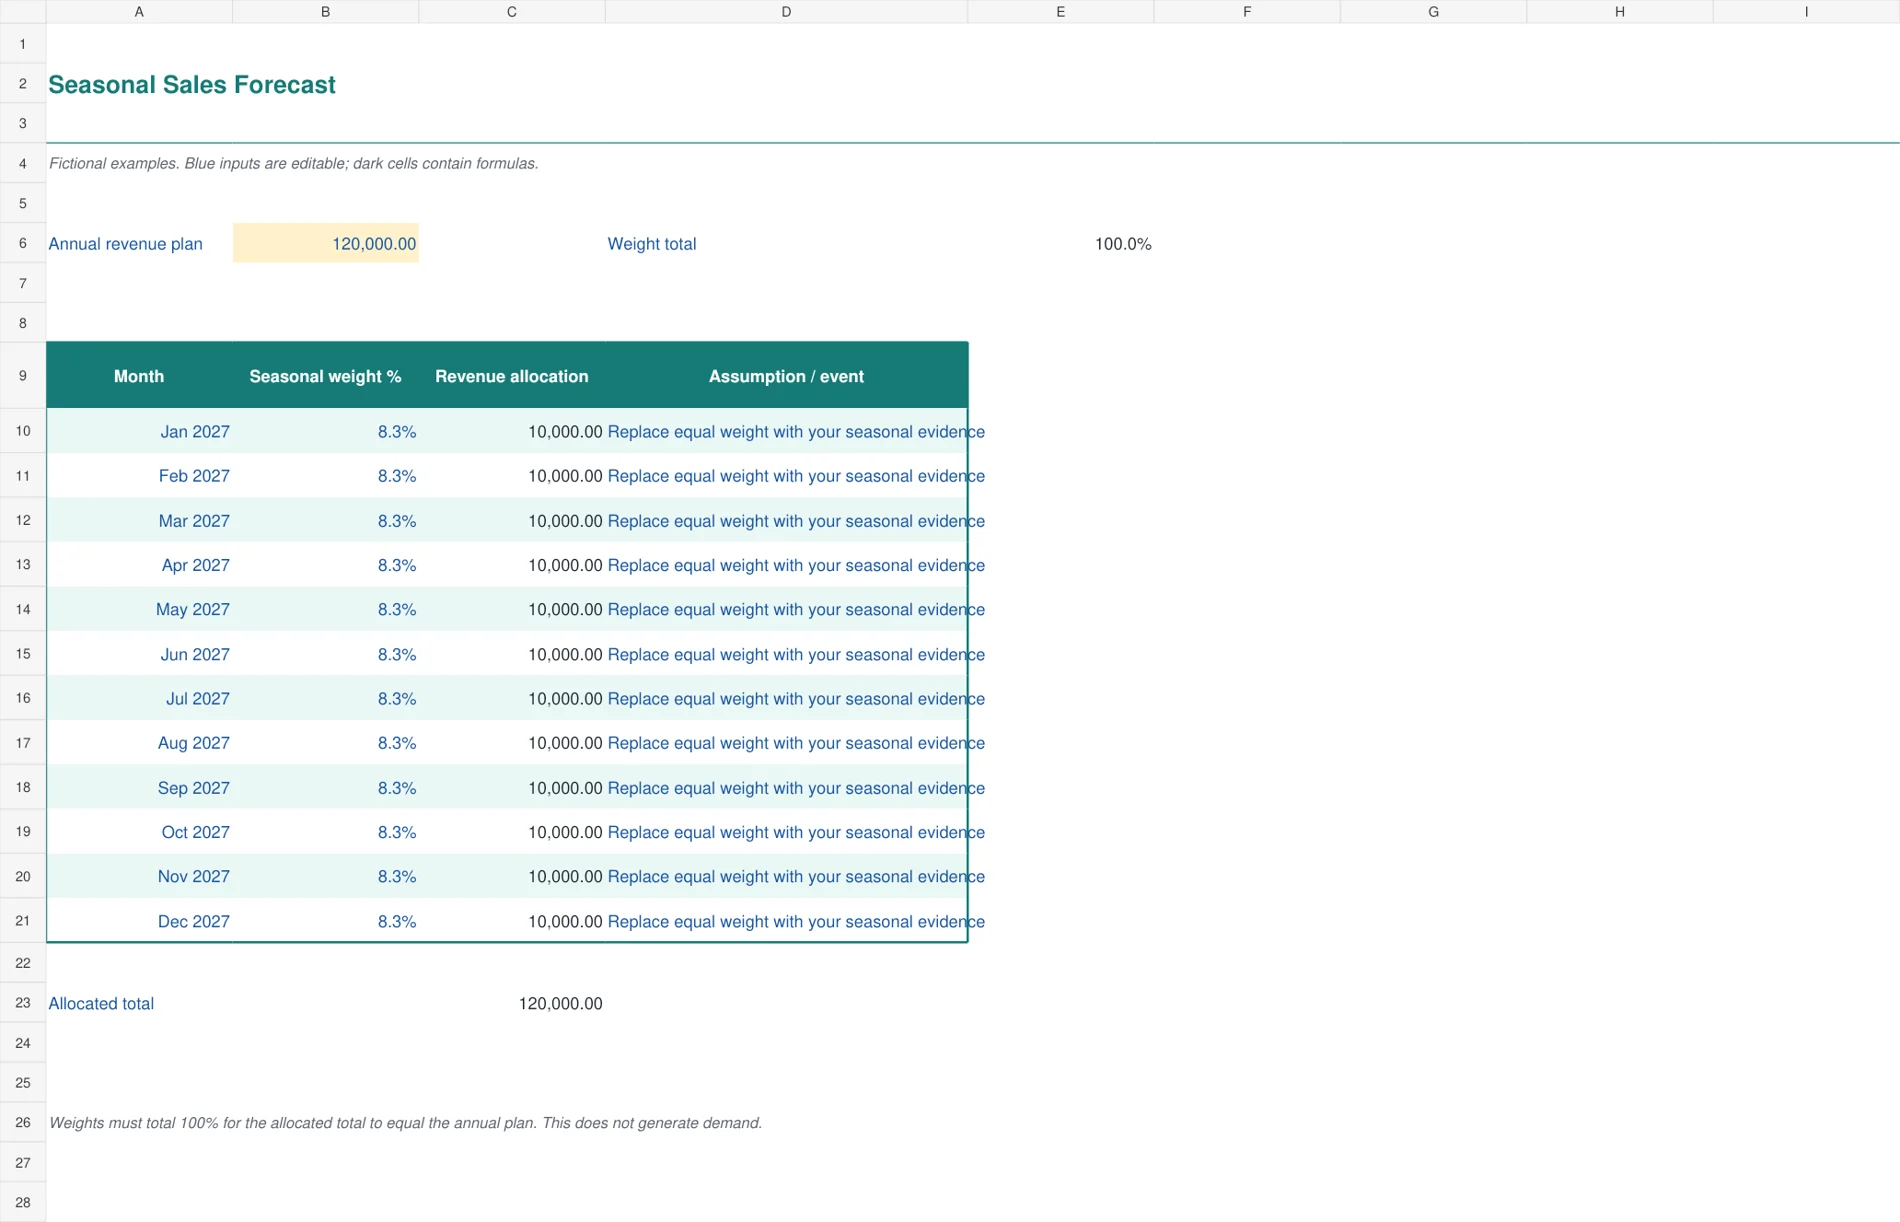
The teal seasonal worksheet allocates an annual revenue plan across twelve monthly weights. It is useful for a business with holiday peaks, weather effects, trading seasons or other recurring patterns. The sample uses equal monthly weights so the mechanics are easy to see. A highlighted weight-total check shows when the entered allocation differs from 100% and therefore no longer matches the annual plan.
Replace equal weights with an evidence-based monthly pattern. An annual plan of 120,000 with a weight of 10% assigns 12,000 to that month. If you raise one month’s weight, reduce another where appropriate so the total remains 100%. This is an allocation of the entered annual plan. It does not prove the annual total or create demand where the business has not identified it.
5. Sales Forecast versus Actuals
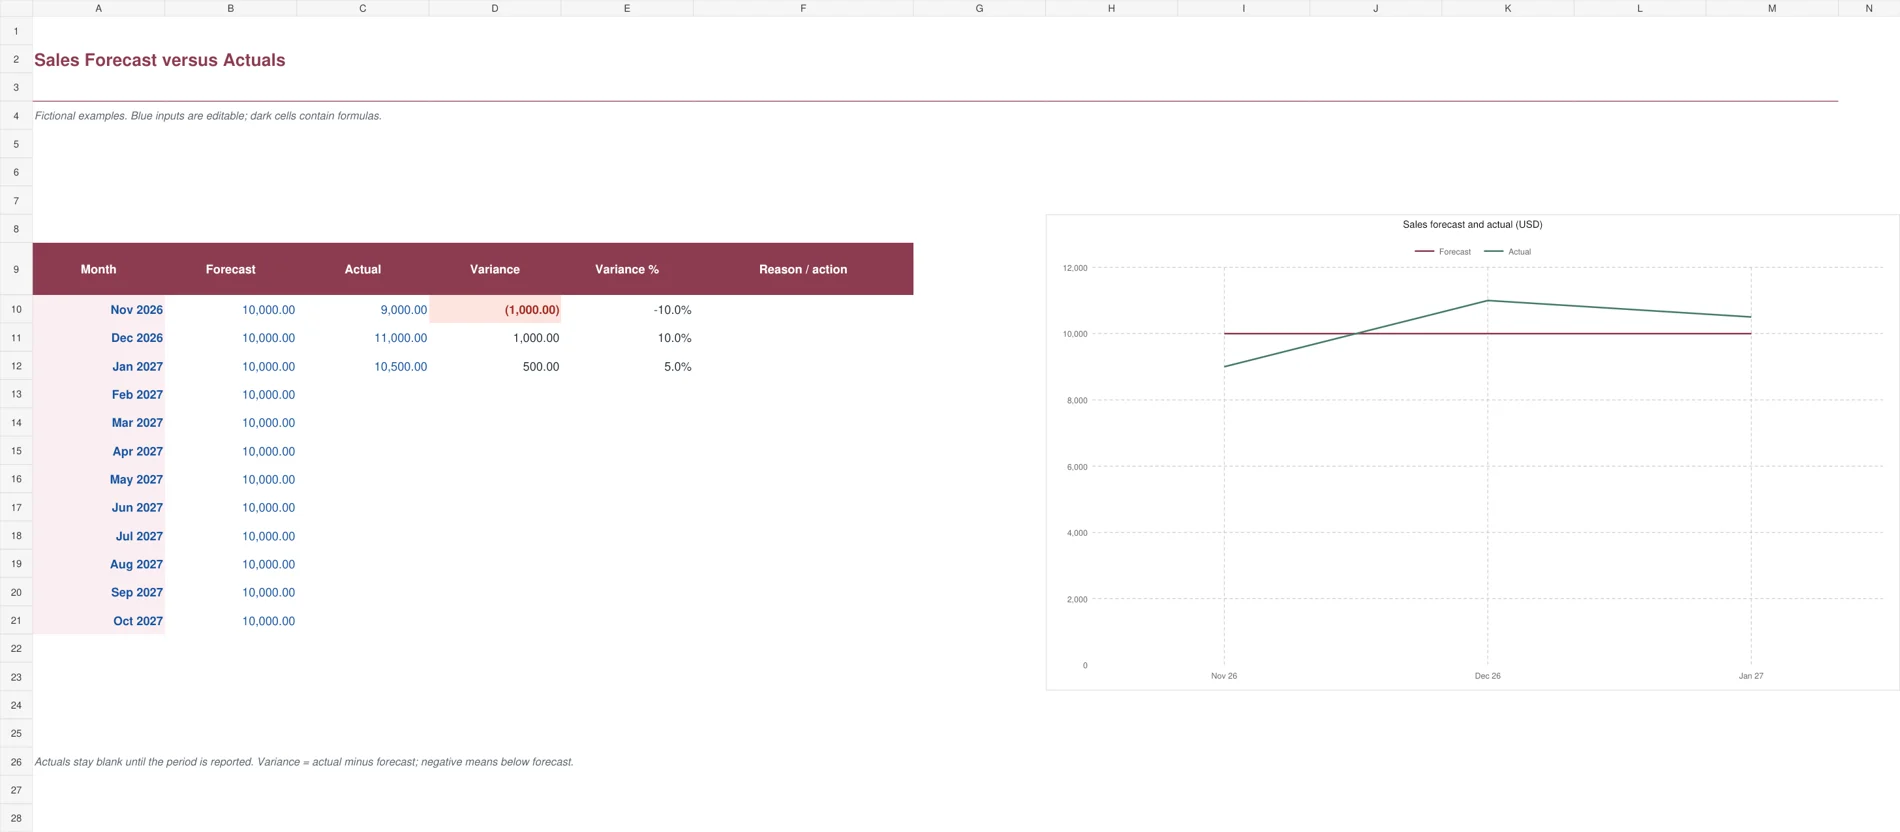
The burgundy review worksheet keeps the original forecast beside reported actual sales. Variance equals actual minus forecast, with a percentage comparison where the forecast is nonzero. Negative results are highlighted and a chart compares the first three populated periods. This helps a monthly review focus on what changed and what the business should learn before preparing the next forecast.
Enter actuals only when the period has been reported. Unreported periods stay blank rather than appearing as zero sales. If forecast revenue is 10,000 and actual sales are 9,000, the variance is minus 1,000, or minus 10%. Keep the reason and next action in the same row. Extend the supplied chart ranges if you want it to show more than the first three periods.
Build assumptions you can explain
Start with recent actual results and ask what will be different in the forecast period. Consider working days, capacity, pricing changes, customer retention and known order timing. Avoid applying one growth rate across every month just because the spreadsheet makes it convenient. A simple forecast should still reflect the business’s real constraints.
Use your sales pipeline records to support opportunity values and expected dates. Review stale opportunities and deals that repeatedly move to a later month. A probability is more useful when it reflects evidence from comparable opportunities and the current buying process than when it is selected to reach a preferred total.
Check prices and discounts against the assumptions in your pricing worksheets. A unit forecast using the list price can overstate revenue if normal transactions include discounts. Likewise, a change in product mix can affect gross profit even when total unit sales are stable. Preserve the distinction between volume, price and cost when discussing a revised forecast.
Read the result at the right level
Monthly growth compounds. Twelve months at 2% is not the same as adding a single 24% increase to the starting month. Each period grows from the previous result. That is why changing an early assumption affects later months in the growth workbook. Review the full curve rather than checking only the first calculation.
Weighted pipeline values are expected-value planning amounts. Three opportunities with weighted values of 6,000 each sum to 18,000, but actual outcomes may be very different if a small number of large deals close or fail. Retain a view of the unweighted opportunities and the key dependencies before using that total to make a spending commitment.
Revenue is also different from cash collected. A sale recorded in November may be paid in December or later. Use the forecast as an input to your wider financial plan, with a separate treatment of collection timing, operating costs and working capital. The five files focus on sales and do not contain an integrated cash-flow model.
A monthly review that improves the next forecast
Keep the version that was agreed before the month began. When actual sales arrive, compare them with that version and identify the reason for a material difference. Separate a delayed sale from a permanently lost sale, and a pricing effect from a change in volume. Those distinctions lead to different revisions for future periods.
Record an action or assumption change beside the variance. If a delivery delay moved revenue into the next month, confirm the revised timing before adding it again. If a discount reduced average price, update the price assumption rather than compensating with unexplained extra units. Avoid rewriting the original forecast simply to remove a variance.
Save a clean master before editing these macro-free files. Copy formulas and extend totals when adding rows. The growth, seasonal, pipeline and actual-review sheets provide twelve periods or opportunities; the product sheet provides ten product rows. Check chart ranges after extending a table because a worksheet can contain more data than a fixed chart currently displays.
For another example of a forecast based on units, growth and gross profit, see Vertex42’s sales forecast guide. Use outside examples to compare structures, then keep the final assumptions grounded in your own business data.
Frequently Asked Questions
Which file is best for a new small business?
Start with Product Sales Forecast if you can estimate units and prices. The visible drivers make uncertain assumptions easier to discuss. Monthly Growth is useful when a credible starting revenue base exists, but a new business should not invent that base simply to produce a smooth chart.
Is weighted pipeline the same as booked revenue?
No. It multiplies potential deal value by an estimated probability for planning. The result is neither a confirmed order nor recognized revenue. Review the actual opportunities, expected dates and dependencies before relying on the weighted total.
Why are some actual results blank?
The variance workbook leaves unreported periods blank to distinguish missing actuals from genuine zero sales. Enter zero explicitly when the reported result is zero. Once a numeric actual is entered, the amount and percentage variance calculate for that period.
Can I use these templates in another currency?
Yes. Change the monetary number format and use one currency consistently in each file. The formulas do not fetch exchange rates. Convert and document foreign-currency inputs through your own reviewed process before combining them with the rest of the forecast.
