
A recipe can look inexpensive until you count the usable yield, the portion that actually reaches the plate and the ingredients bought at last week’s price. For a café or small baking business, those details can change the cost of a familiar item without any visible change to the menu.
These five free recipe costing Excel templates help you work through that calculation in different ways. Start with a batch cost, adjust an ingredient for usable yield, compare menu prices, scale a baking order or build a catering quote. Each file has a distinct visual treatment, editable calculations and a preview before the download button.
First, make the quantities comparable
A cost calculation needs compatible units. If a flour pack is recorded in grams, the recipe quantity on that row must also be in grams. Do not divide a kilogram price by a recipe amount entered in grams without converting one side. The worksheets deliberately include a unit field so the assumption remains visible. They do not silently convert cups, grams, milliliters or pieces.
Choose the cost basis you intend to use. A recent supplier price can be useful for the next production run, while an older purchase price may explain a completed batch. Keep the supplier or date note with the input so you know what the calculation represents. Update prices consistently rather than replacing only the most noticeable ingredient.
Measure the finished yield as well. A recipe expected to produce twelve portions may provide only ten saleable portions at the portion size you actually serve. Dividing by twelve would understate the portion cost. Record the practical yield and use the same serving size when comparing the result with the selling price.
Five kitchen costing workbooks
1. Recipe Batch Cost Calculator
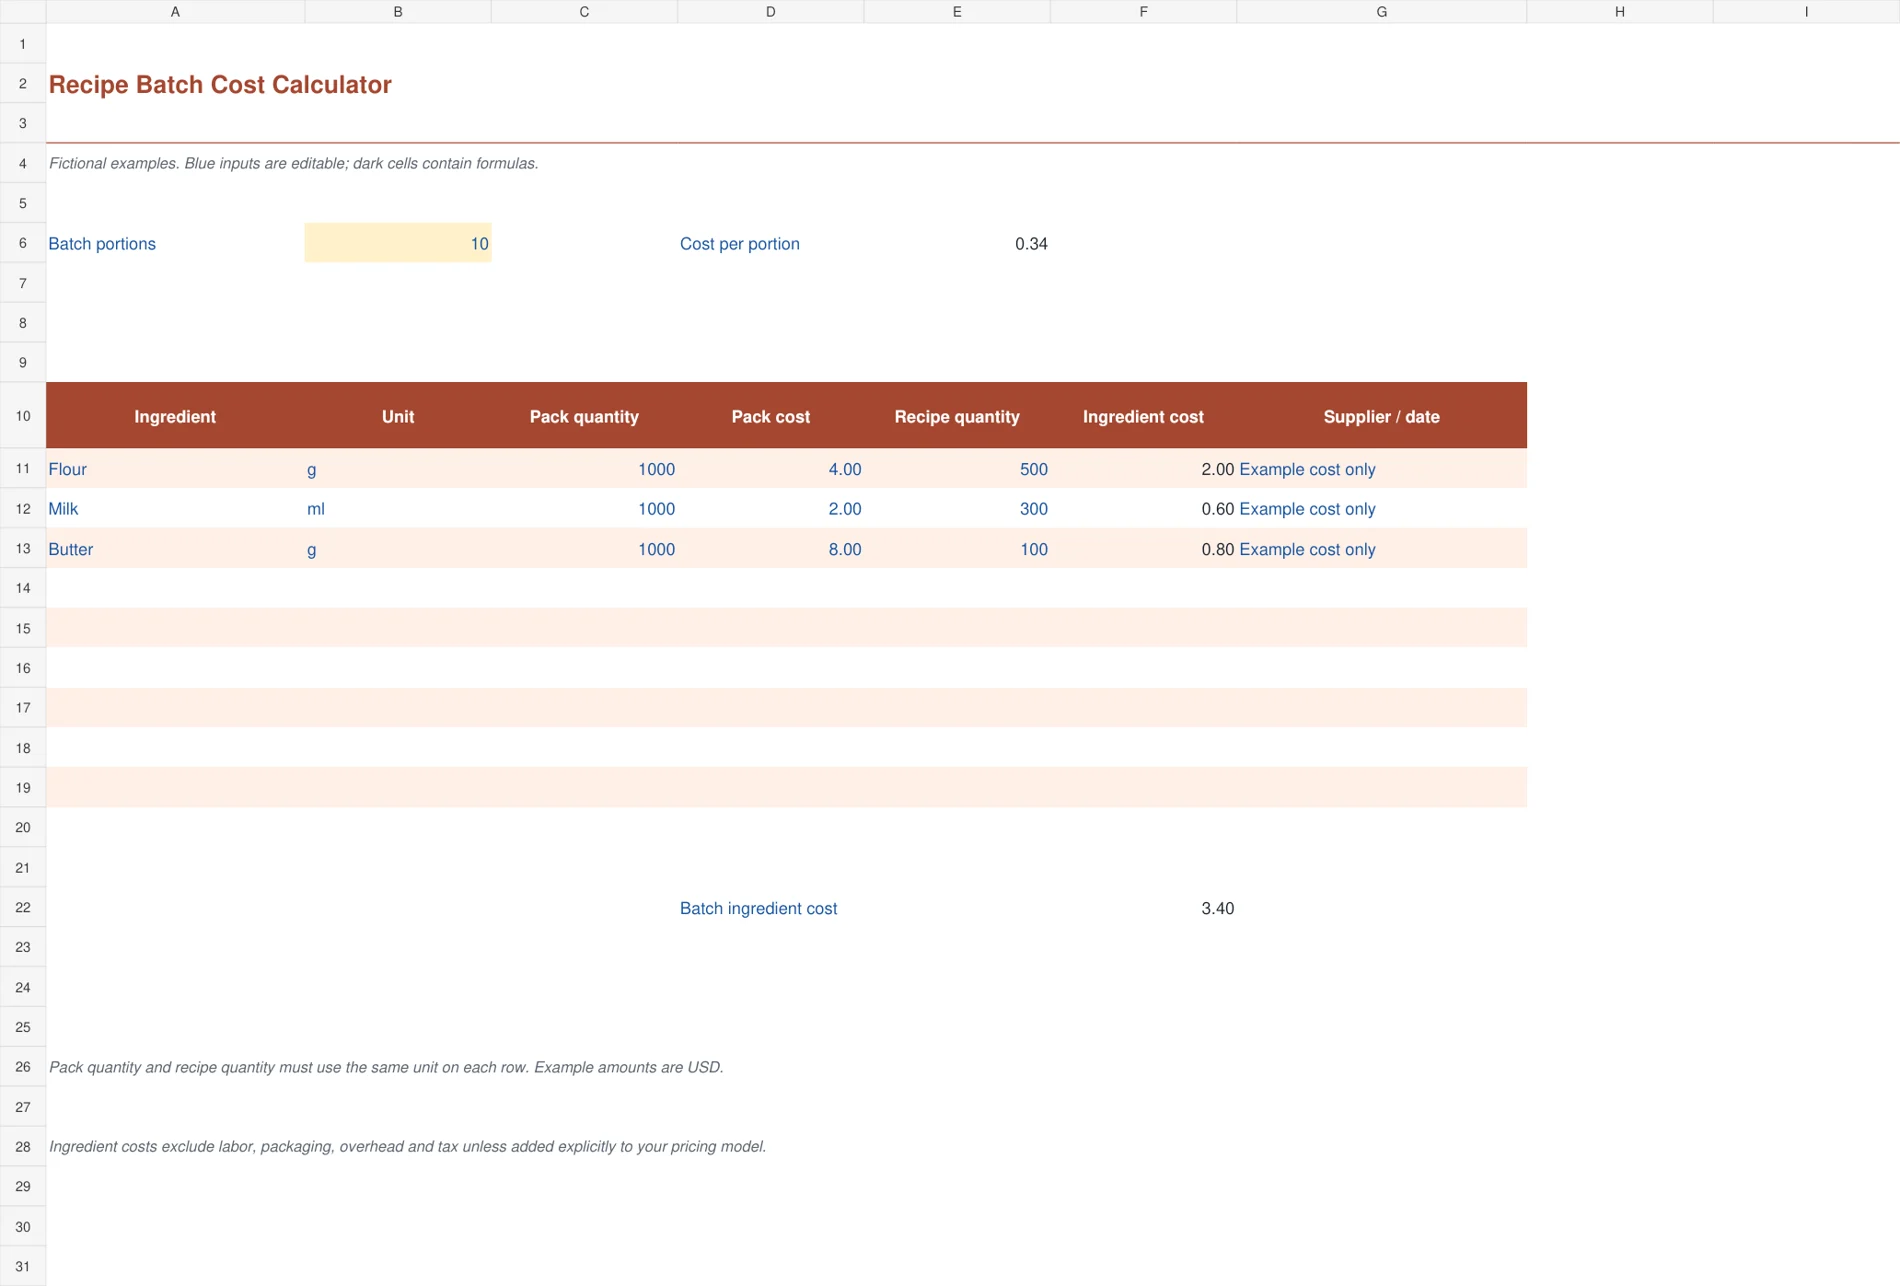
The terracotta batch calculator starts with pack quantity, pack cost and the quantity used in one recipe. Each ingredient’s contribution calculates separately, followed by total batch ingredient cost and cost per portion. The layout gives the ingredient name and supplier note enough room to stay readable. It is a practical first file for a café recipe, a home-baking product or a repeat menu item.
Use the same unit for pack quantity and recipe quantity on each row. If a 1,000-gram flour pack costs 4 and the recipe uses 500 grams, flour contributes 2. The sample batch costs 3.40 across its three ingredients and produces ten portions, giving 0.34 per portion. Replace the portion yield with the number of usable servings you actually obtain.
2. Ingredient Yield Cost Calculator
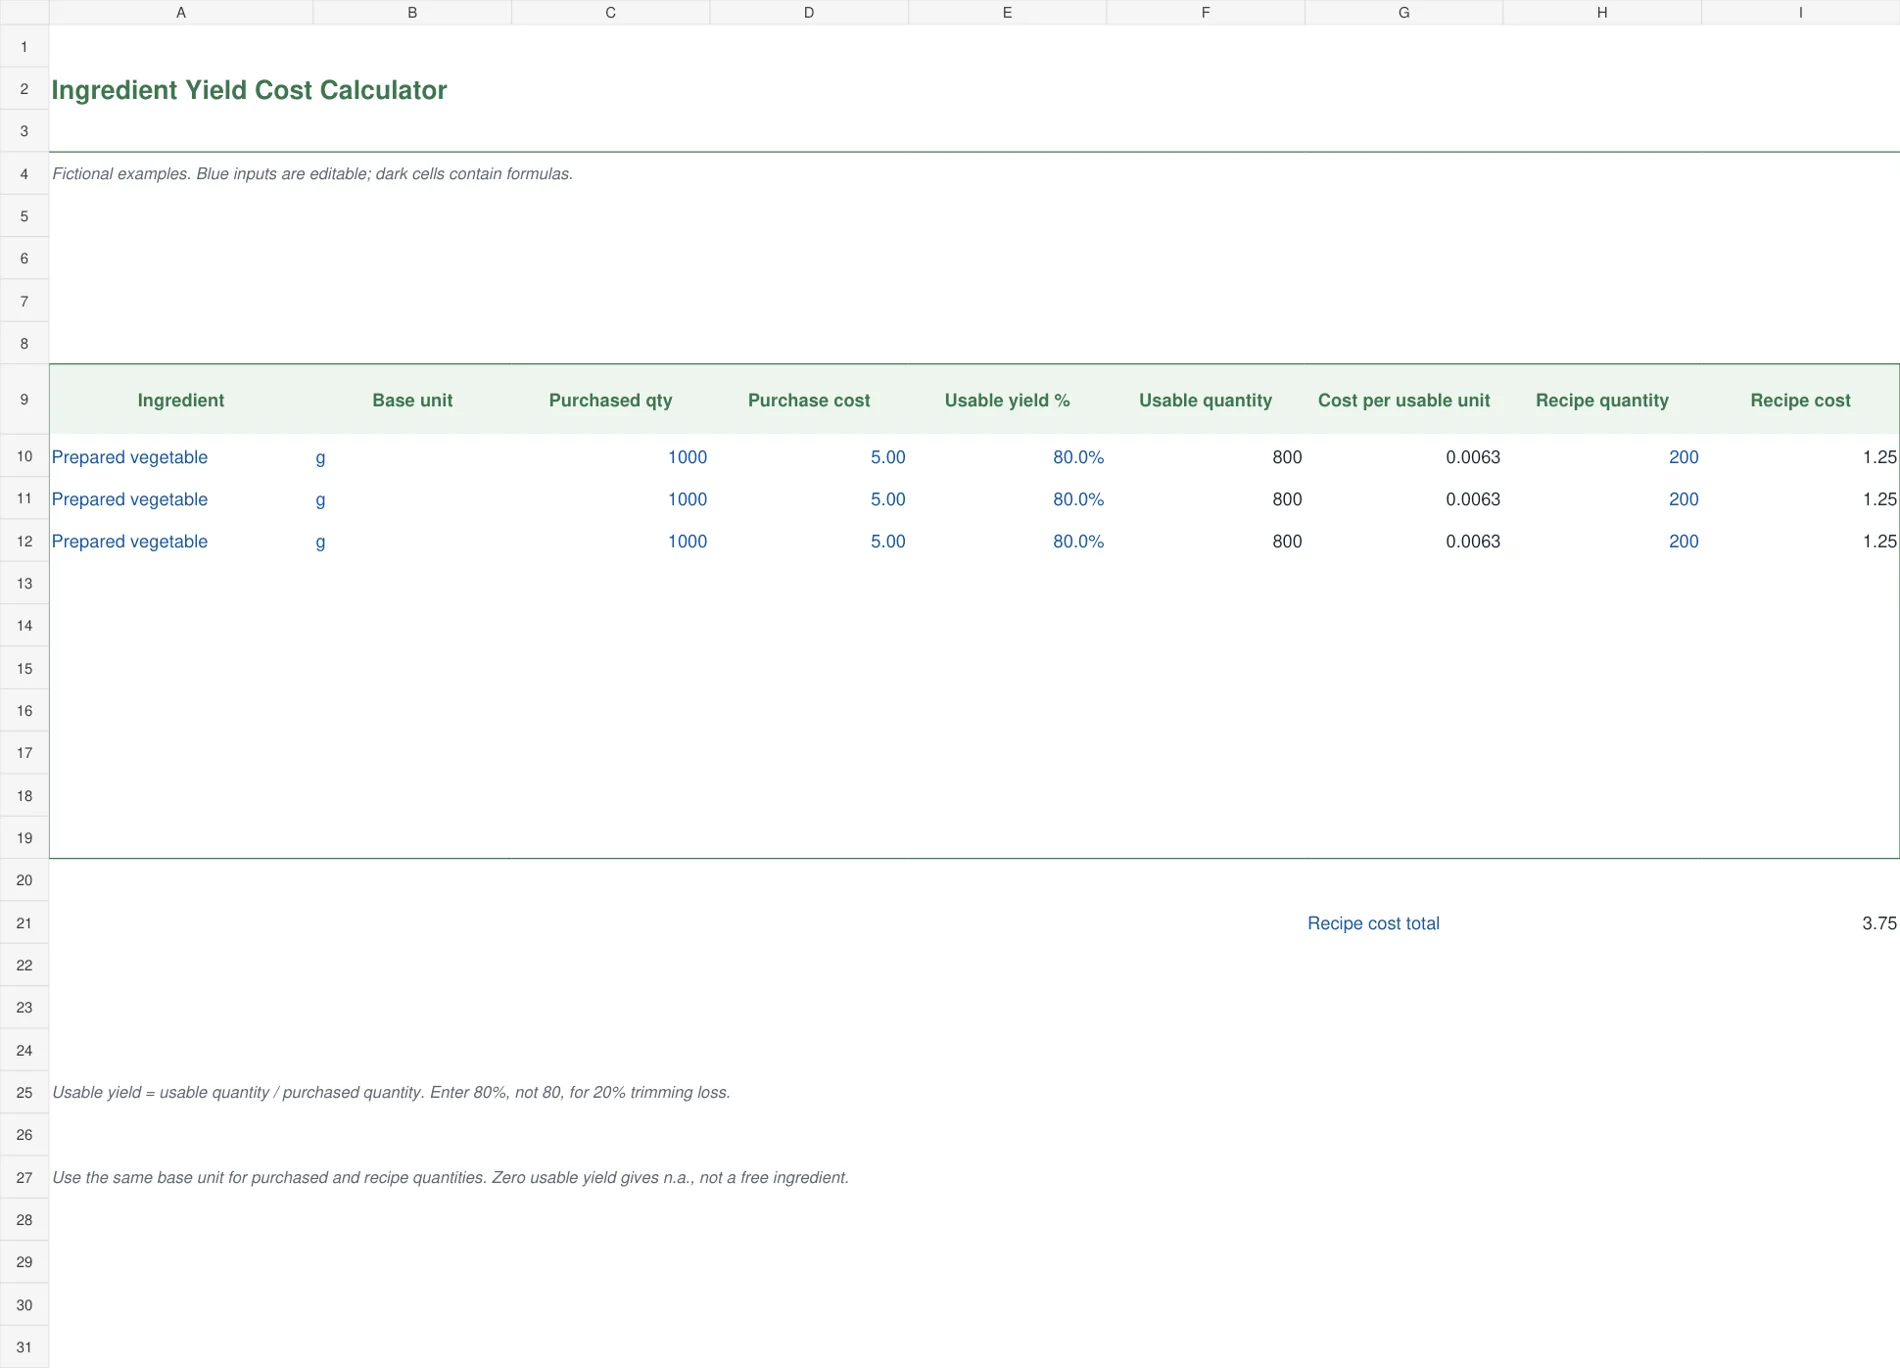
The sage yield worksheet accounts for the difference between what you purchase and what can be used. Purchased quantity and usable-yield percentage calculate usable quantity. Purchase cost divided by that usable quantity produces a unit cost, which then prices the recipe quantity. This is helpful for ingredients that lose weight through trimming or preparation and would otherwise appear cheaper than they really are.
A 1,000-gram purchase costing 5 with an 80% usable yield provides 800 usable grams. Cost per usable gram is 0.00625, so a 200-gram recipe quantity costs 1.25. At a 50% yield, the same recipe quantity costs 2. Enter a measured yield where possible and avoid applying the same waste allowance again elsewhere in the recipe.
3. Menu Price and Food Cost
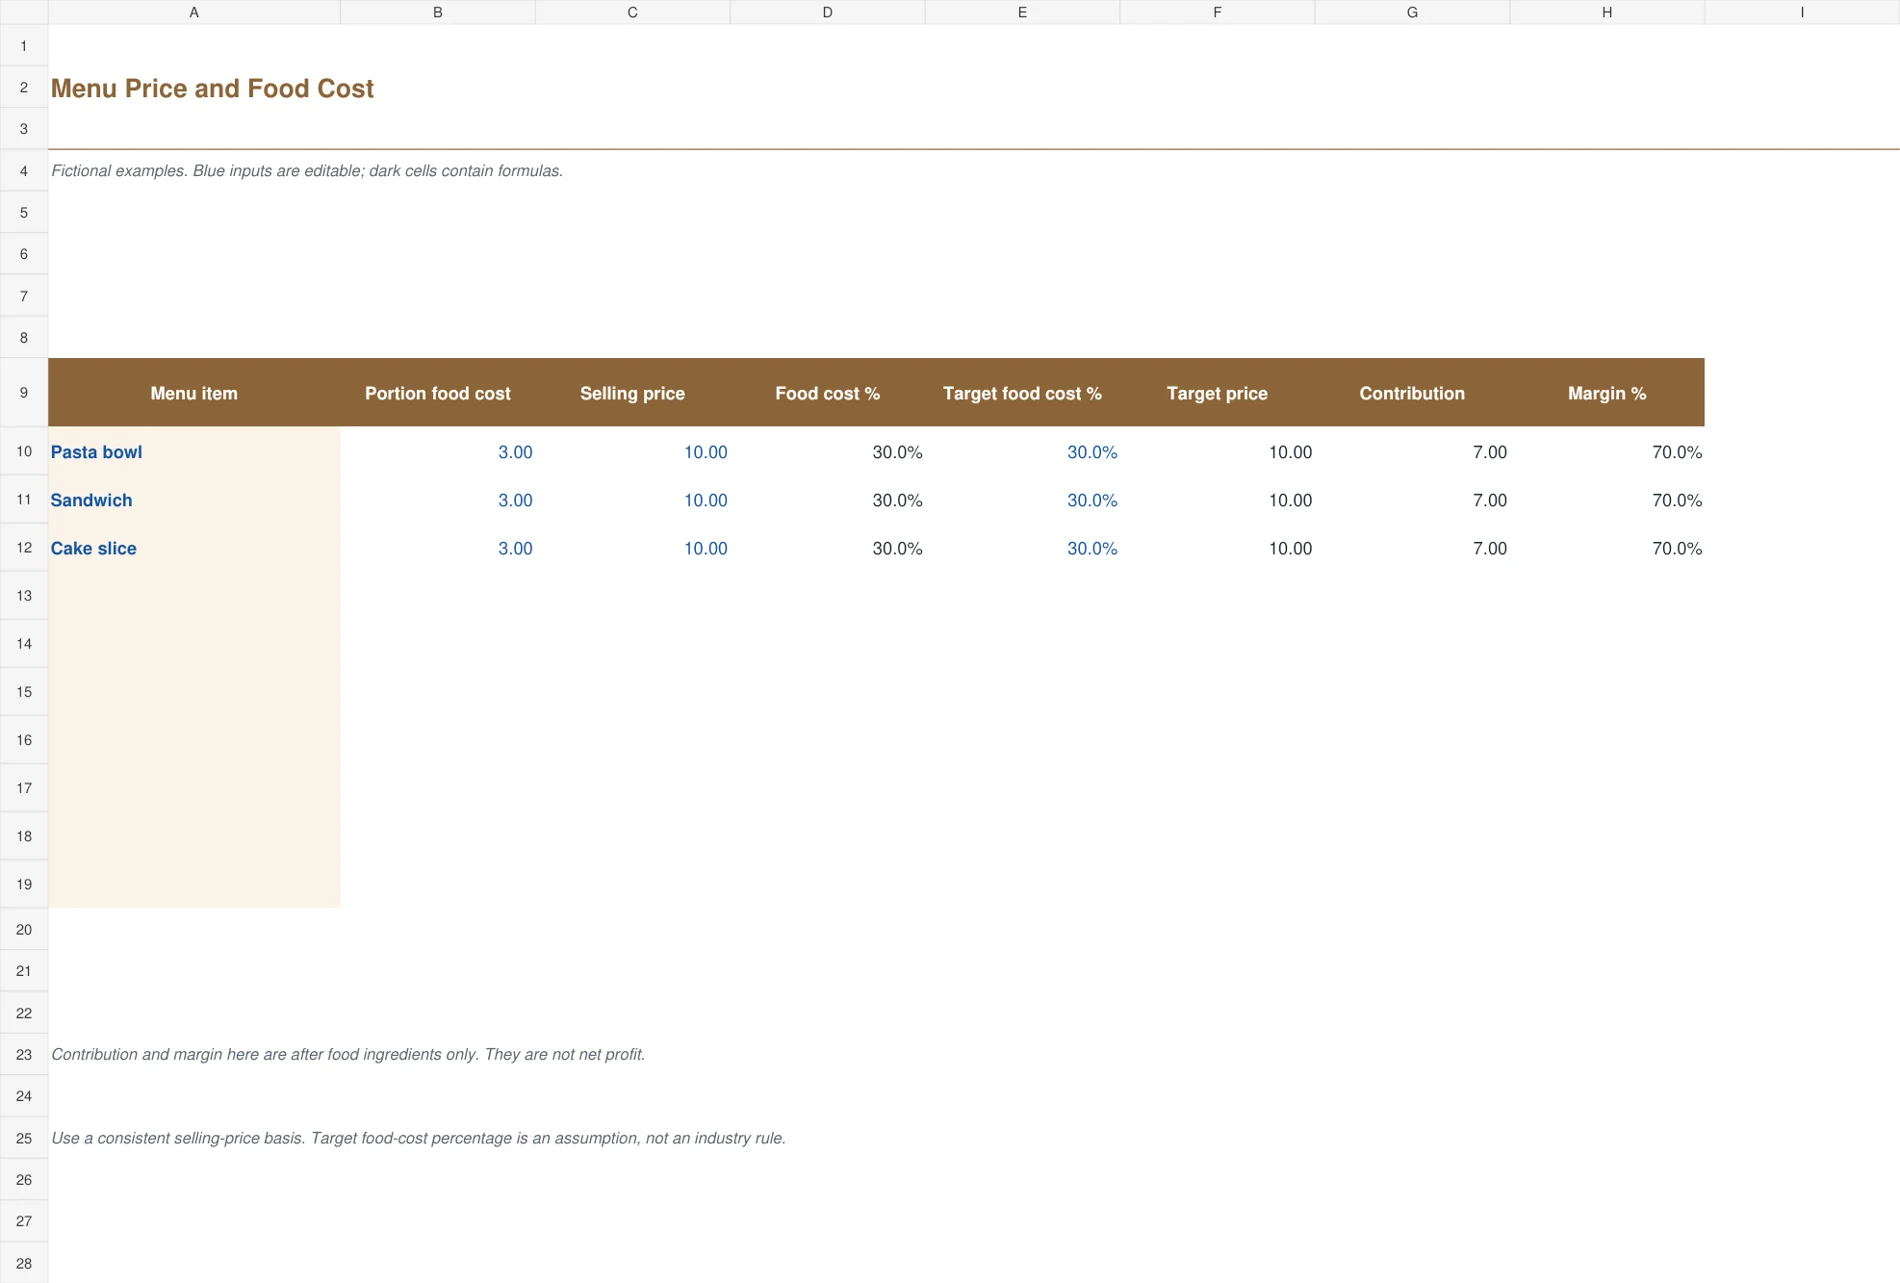
The warm brown menu worksheet compares portion ingredient cost with selling price, target food-cost percentage and a calculated target price. It also shows the amount and percentage left after food ingredients. This makes the distinction between a costing result and a pricing decision visible. A highlighted food-cost percentage identifies rows above the entered target so you can review the recipe, portion size or selling price.
With a portion food cost of 3 and selling price of 10, food cost is 30%. A target of 30% produces a target price of 10. Raising ingredient cost to 4 raises that target price to about 13.33. The remaining amount is contribution after ingredients, not net profit. Labor, rent, packaging and other costs still need to be considered before adopting a menu price.
4. Bakery Batch Scaling
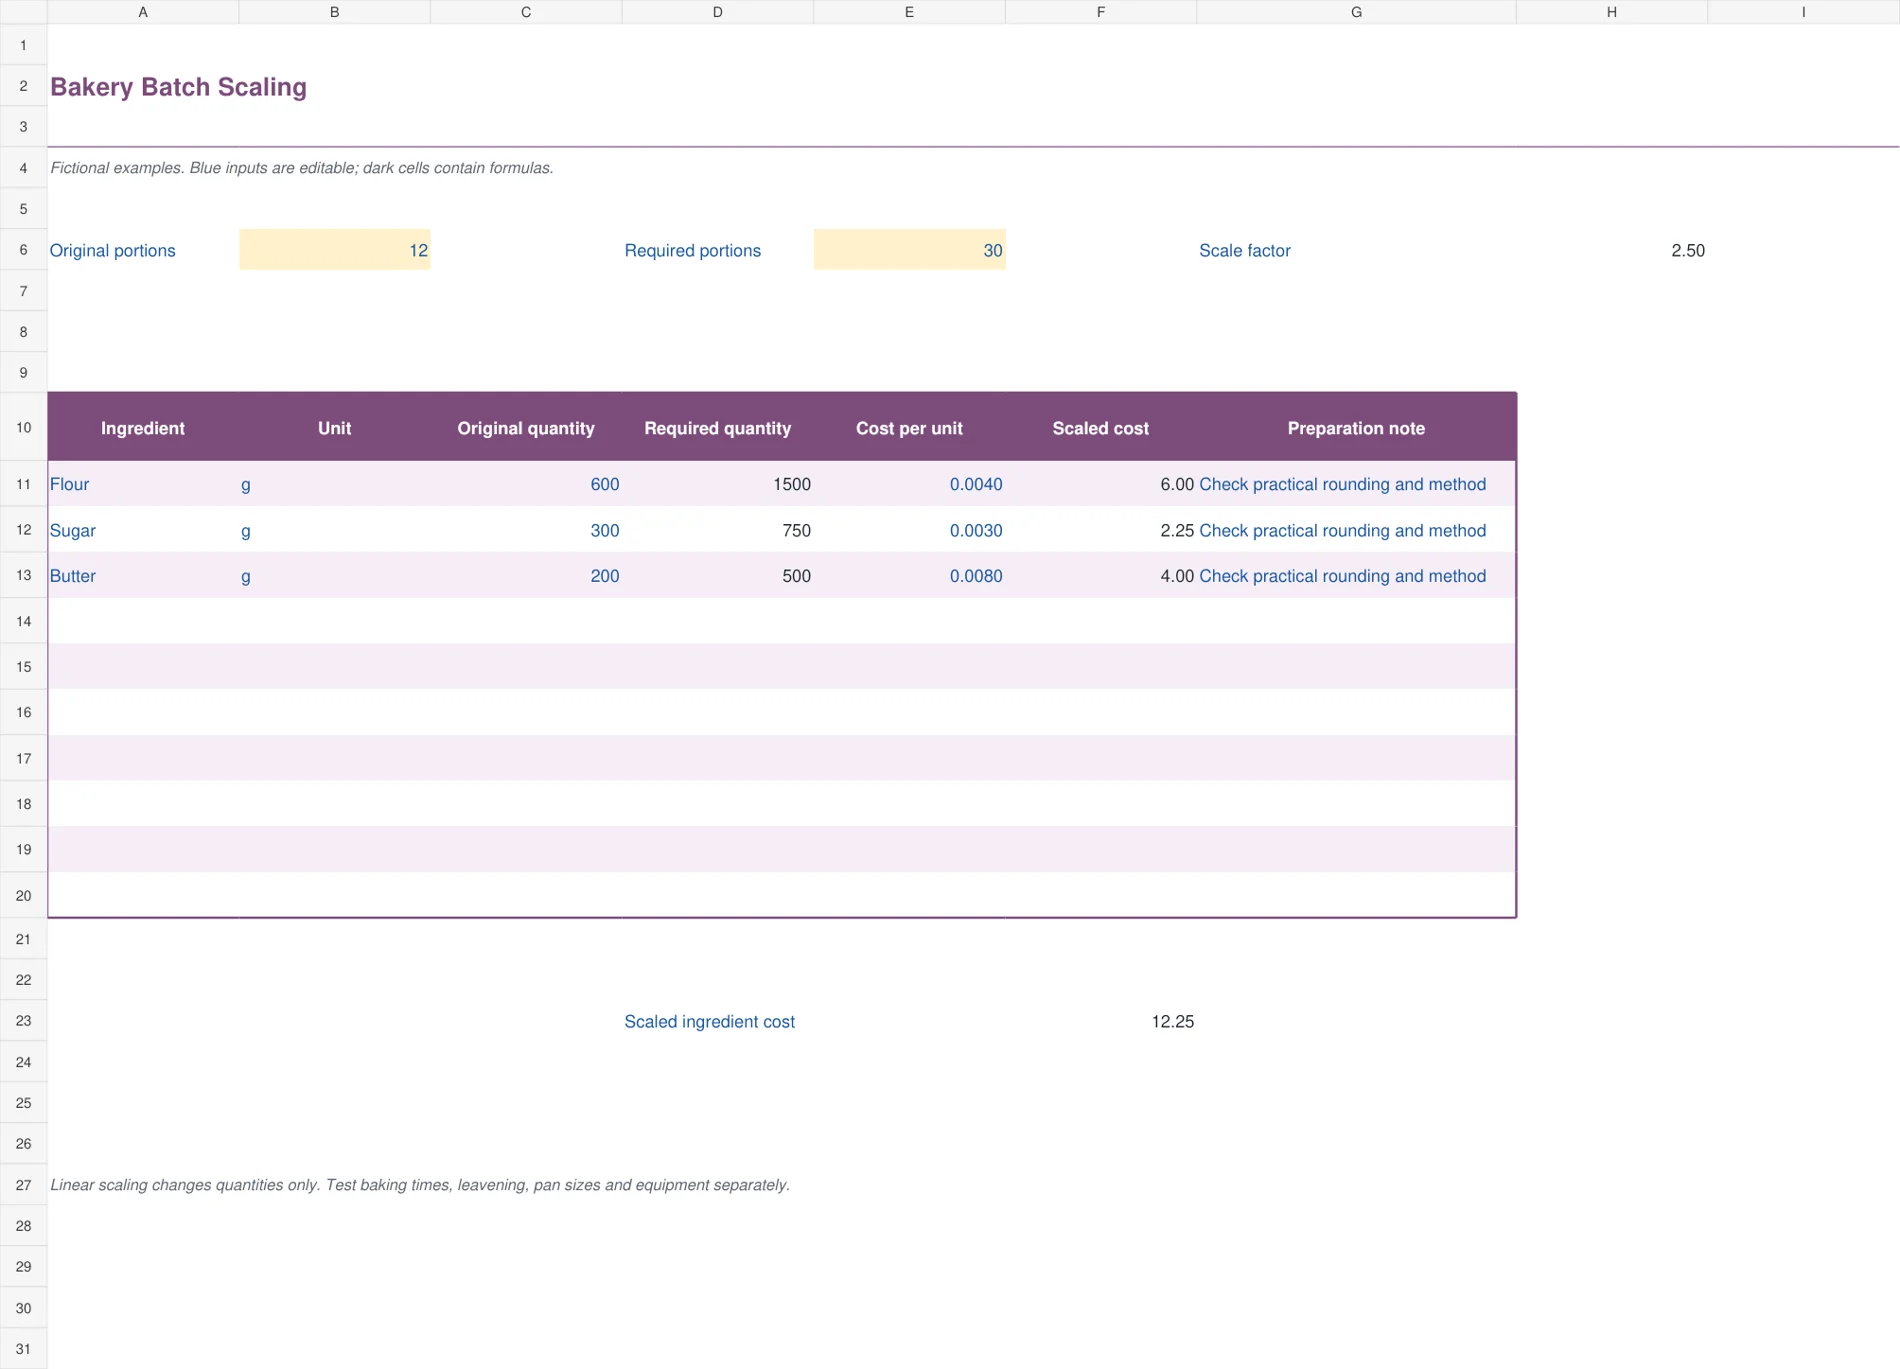
The plum scaling sheet converts an original recipe into a different number of portions. Original quantities remain visible beside required quantities and unit costs. The scaling factor is shared across the ingredient list, so a change to required portions updates the same recipe consistently. It is useful for planning a larger order without repeatedly replacing the original quantities and losing the starting recipe.
An original recipe for twelve portions scaled to thirty uses a factor of 2.5. An original flour quantity of 600 grams becomes 1,500 grams. Changing the requirement to twenty-four portions produces 1,200 grams. Linear quantity scaling does not establish new baking times, equipment limits or leavening behavior. Test the method and practical rounding before producing a large customer order.
5. Catering Portion Quote
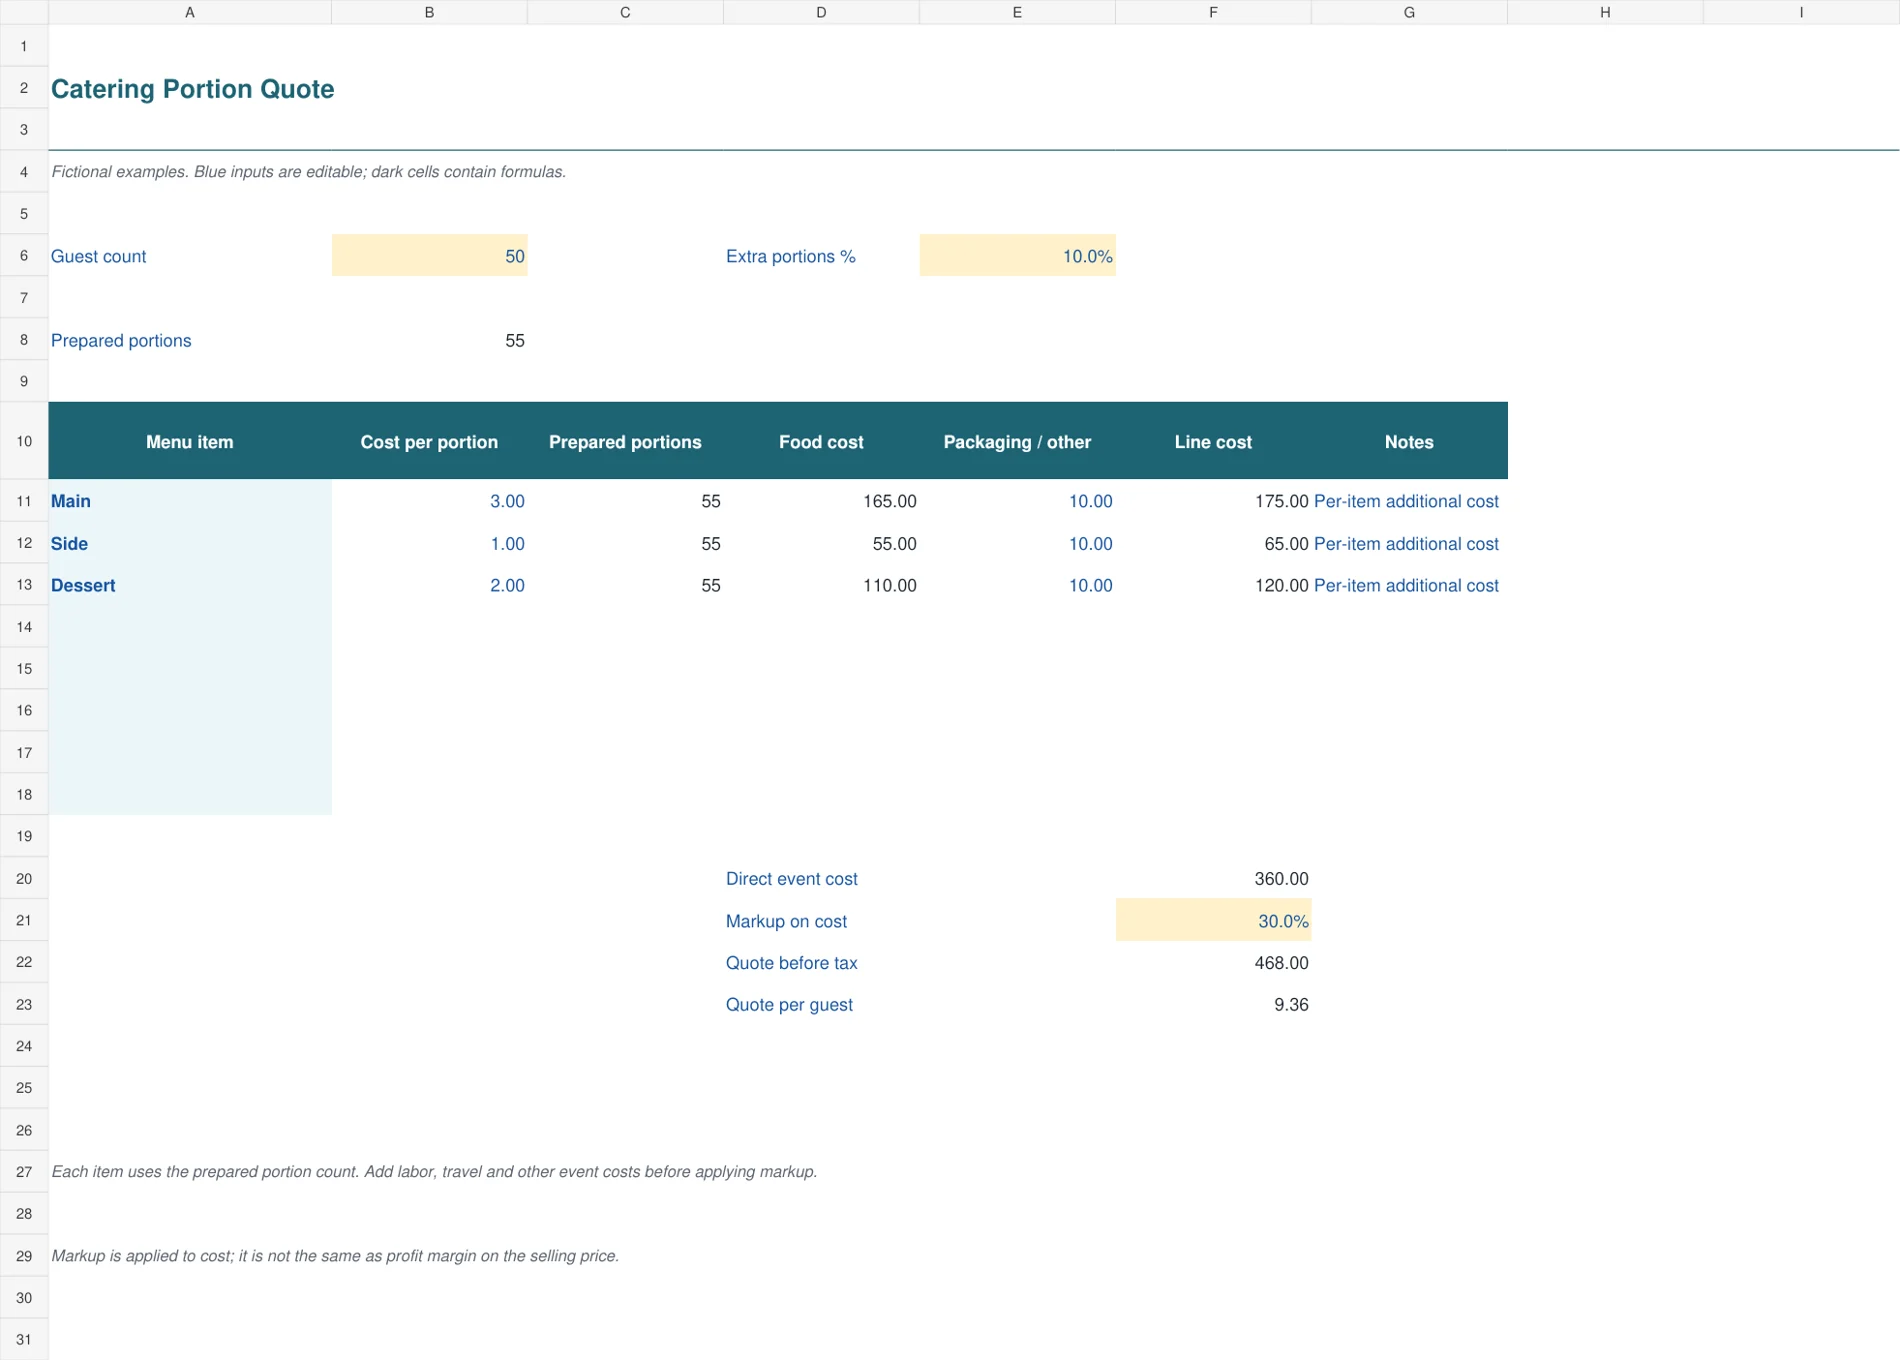
The deep teal catering sheet begins with guests and an extra-portions percentage, then rounds prepared portions up to a whole number. Each menu item uses that prepared count, a cost per portion and an entered allowance for packaging or other line costs. The quote adds a markup to the direct event cost and calculates a price per guest. This suits an early quote build-up with clearly stated inclusions.
The sample has fifty guests, 10% extra portions and three food items costing 6 per prepared portion in total. With fifty-five portions and 30 of additional line costs, direct event cost is 360. A 30% markup produces a quote of 468 before tax. Add labor, delivery, equipment and other relevant event costs explicitly. Markup on cost is different from margin on the selling price.
A closer look at food cost and menu price
Food-cost percentage is portion ingredient cost divided by the selling price on the same basis. At a food cost of 3 and selling price of 10, that is 30%. It answers how much of the selling price is consumed by the food ingredients included in the calculation. It does not tell you the business’s final profit margin.
A target food-cost percentage can help generate a starting price. Divide portion food cost by the chosen percentage. At cost 4 and a target of 30%, the result is about 13.33. The target is an editable assumption, not a universal restaurant rule. Customer demand, local pricing, labor intensity and the rest of the cost structure still matter.
Markup uses a different denominator. A 30% markup on cost 10 produces a price of 13. The amount above cost is 3, which is about 23.1% of the selling price. Confusing markup with margin can make a quote less profitable than intended. The catering workbook labels its input as markup on cost to make that distinction explicit.
Keep purchasing, stock and recipes connected
Use your inventory spreadsheet to keep ingredient quantities and purchasing records organized. Stock records and recipe costs serve different tasks, but a consistent ingredient name and base unit make it easier to compare them. A recipe calculation should not rely on a supplier description that nobody can match to the actual item in storage.
If a supplier changes pack size, update both the quantity and price. A lower pack price can still mean a higher unit cost when the pack is smaller. The yield calculator makes a similar point about usable quantity: a cheaper untrimmed ingredient is not necessarily cheaper per usable gram.
Compare the resulting target with your pricing worksheet before changing a menu. Record the reasoning for a rounded selling price and check the resulting food-cost percentage again. If a price includes tax or service charges, keep the comparison basis consistent rather than mixing an inclusive selling price with a different cost basis.
Use the result in a real production routine
Keep a clean master recipe and review it after a supplier change, portion change or preparation change. Ask the kitchen to use the measured serving size so the cost calculation remains connected to production. Where waste is significant, measure it over a representative run and distinguish trimming loss from avoidable spoilage.
For baking, scale the ingredient quantities first and then check the method separately. Mixing, resting, pan sizes and cooking times may not scale in a straight line. The spreadsheet gives an ingredient plan; the practical process still needs testing. Record any tested adjustments instead of silently changing the master recipe to fit one large order.
For catering, confirm what each cost per portion includes and whether every menu item will be prepared for the full guest count. The supplied model applies the same prepared count to each row. If only some guests receive an item, change that row’s portion calculation deliberately and keep the choice visible. Include event-specific costs before relying on the quote.
Review the wider business result through your profit and loss records. A menu item can have an acceptable ingredient percentage while the overall business struggles with labor, rent or low sales volume. These recipe files focus on ingredients and the explicitly entered quote costs; they are not a complete restaurant accounting model.
The files are macro-free .xlsx workbooks with eight catering lines or ten ingredient/menu lines. Extend formulas and totals before adding more. For another industry example of recipe and menu costing, see RestaurantOwner’s recipe-cost spreadsheet overview.
Frequently Asked Questions
Do the files convert cups to grams automatically?
No. Use a compatible base unit on each row and convert your quantities before entering them. A cup of one ingredient can weigh differently from a cup of another, so a single universal cup-to-gram conversion would create unreliable costs.
Which workbook accounts for trimming loss?
Use Ingredient Yield Cost Calculator. It prices the recipe from the usable quantity after the entered yield percentage. Avoid adding the same trimming allowance again in another part of the calculation. A zero usable yield gives n.a. rather than treating the ingredient as free.
Does the menu worksheet calculate net profit?
No. Its contribution and margin are after the food ingredients entered on that row. Labor, occupancy, utilities, packaging and other business costs remain outside the calculation unless you account for them in a wider model. Use the result as one part of a pricing decision.
Can the bakery file safely scale every recipe?
It scales ingredient quantities linearly. It does not determine how leavening, pan dimensions, mixing or cooking time should change. Test the production method and practical rounding before using a substantially larger batch for a customer order.
