
Your team has four people, but that does not mean every project has four people available all week. Leave, recurring meetings, administration and other commitments reduce usable time. Resource capacity planning Excel templates make those assumptions visible before a deadline turns into an overtime problem.
The five free workbooks below cover weekly staff allocation, project roles, sprint availability, monthly staffing and service-desk demand. Each file uses a different visual treatment and calculation model. All are editable, macro-free Excel downloads with fictional examples and a preview so you can choose the right starting point.
Start with the planning question
Ask what decision the sheet should support. A supervisor assigning next week’s tasks needs a person-by-person view. A project manager negotiating access to specialist staff needs a role view. A business planning for a seasonal workload may need monthly productive hours and hiring scenarios. Using the wrong time period can make a detailed spreadsheet answer the wrong question.
Then choose one unit for the comparison. These templates compare demand and capacity in hours. Convert request handling from minutes to hours before comparing it with staffing. Keep story points separate because they represent a team’s relative estimate, not a universal time unit. A project budget in money also needs an explicit conversion before it can be compared with available staff time.
Define who is included. Contractors, part-time staff and specialists may have different availability. Record their actual contribution instead of applying the full-time default to everyone. Use the same period for demand and capacity, and explain whether the plan includes travel, supervision, recurring work and support tasks that are easy to forget.
Work through a weekly capacity example
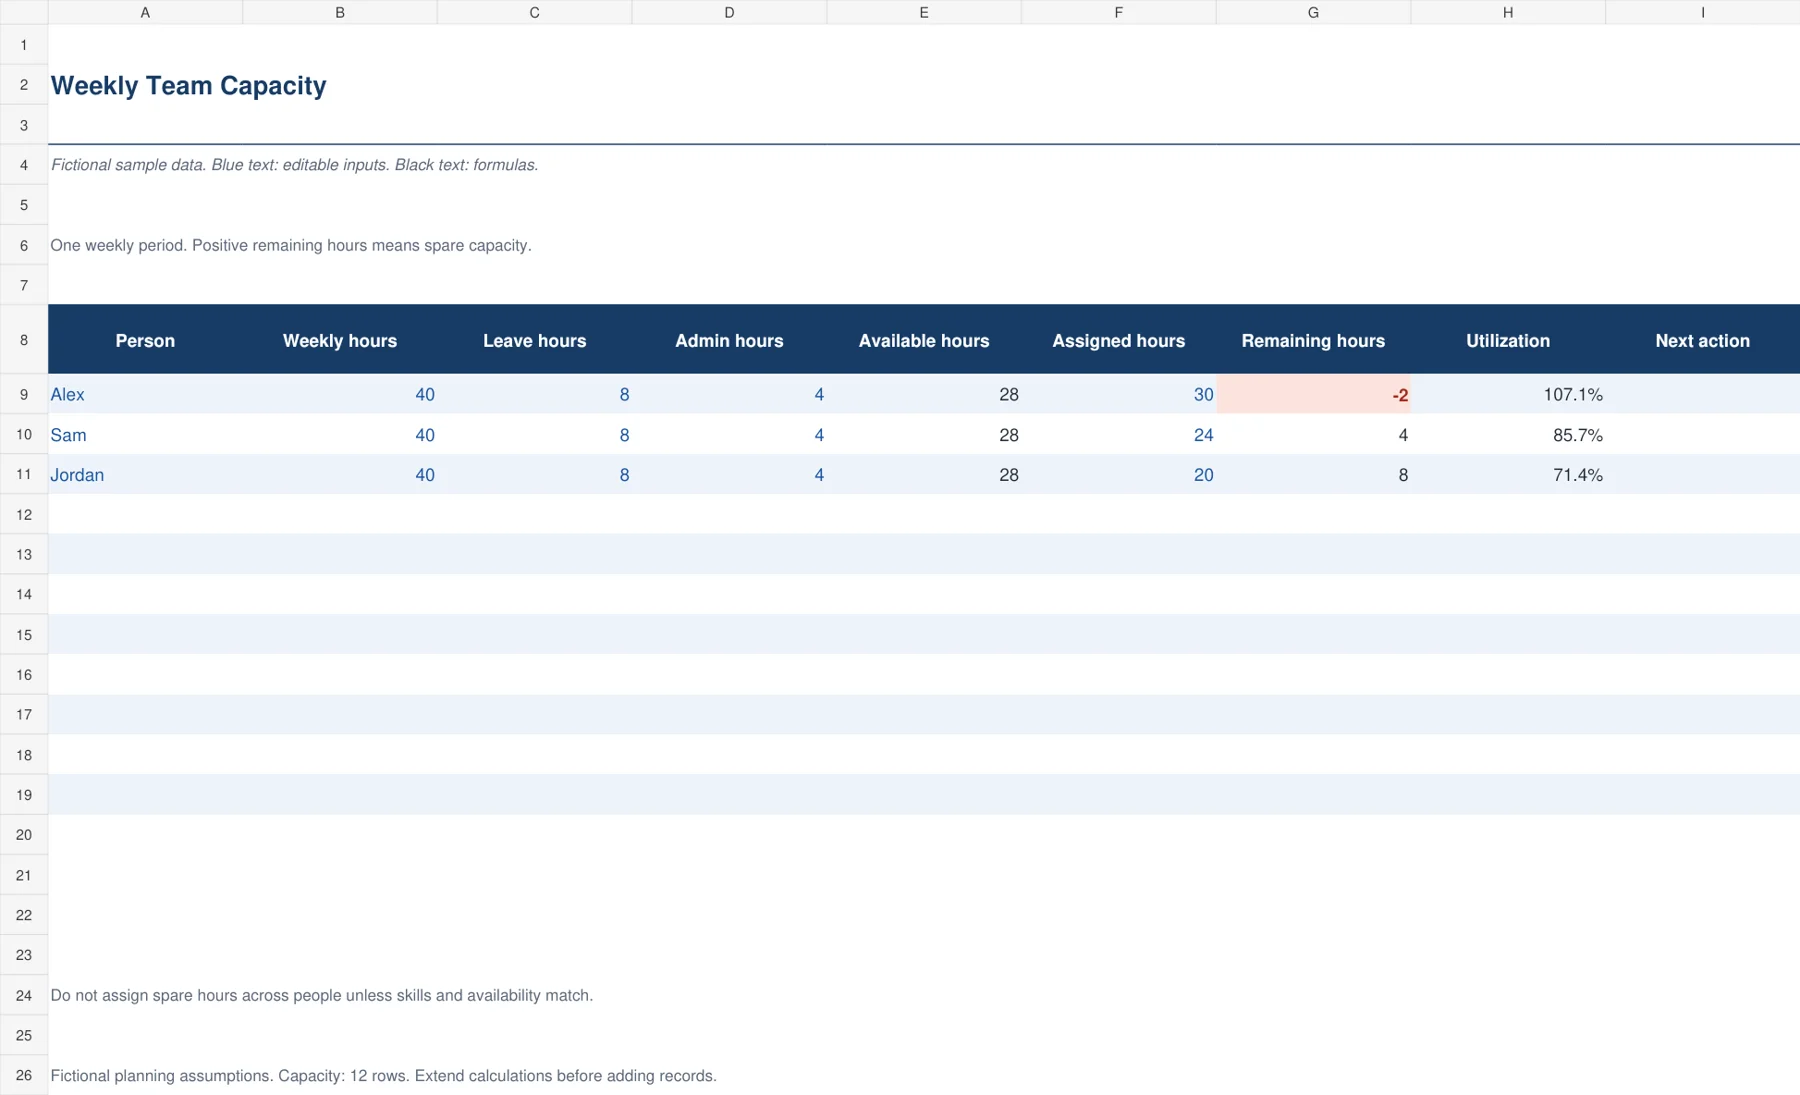
Suppose Alex has a 40-hour week, eight hours of leave and four hours of administration. Available capacity is 28 hours. Assigning 30 hours creates a remainder of minus two and utilization of about 107.1%. The team should resolve that overload before adding another task. Reducing assigned work to 20 hours creates eight spare hours and utilization of about 71.4%.
Spare time is useful only when it can do the work required. A colleague with ten available hours cannot automatically cover a specialist testing task. Review role, location, timing and access before redistributing work. The project-role worksheet makes that conversation more precise by showing the hours available within each skill group.
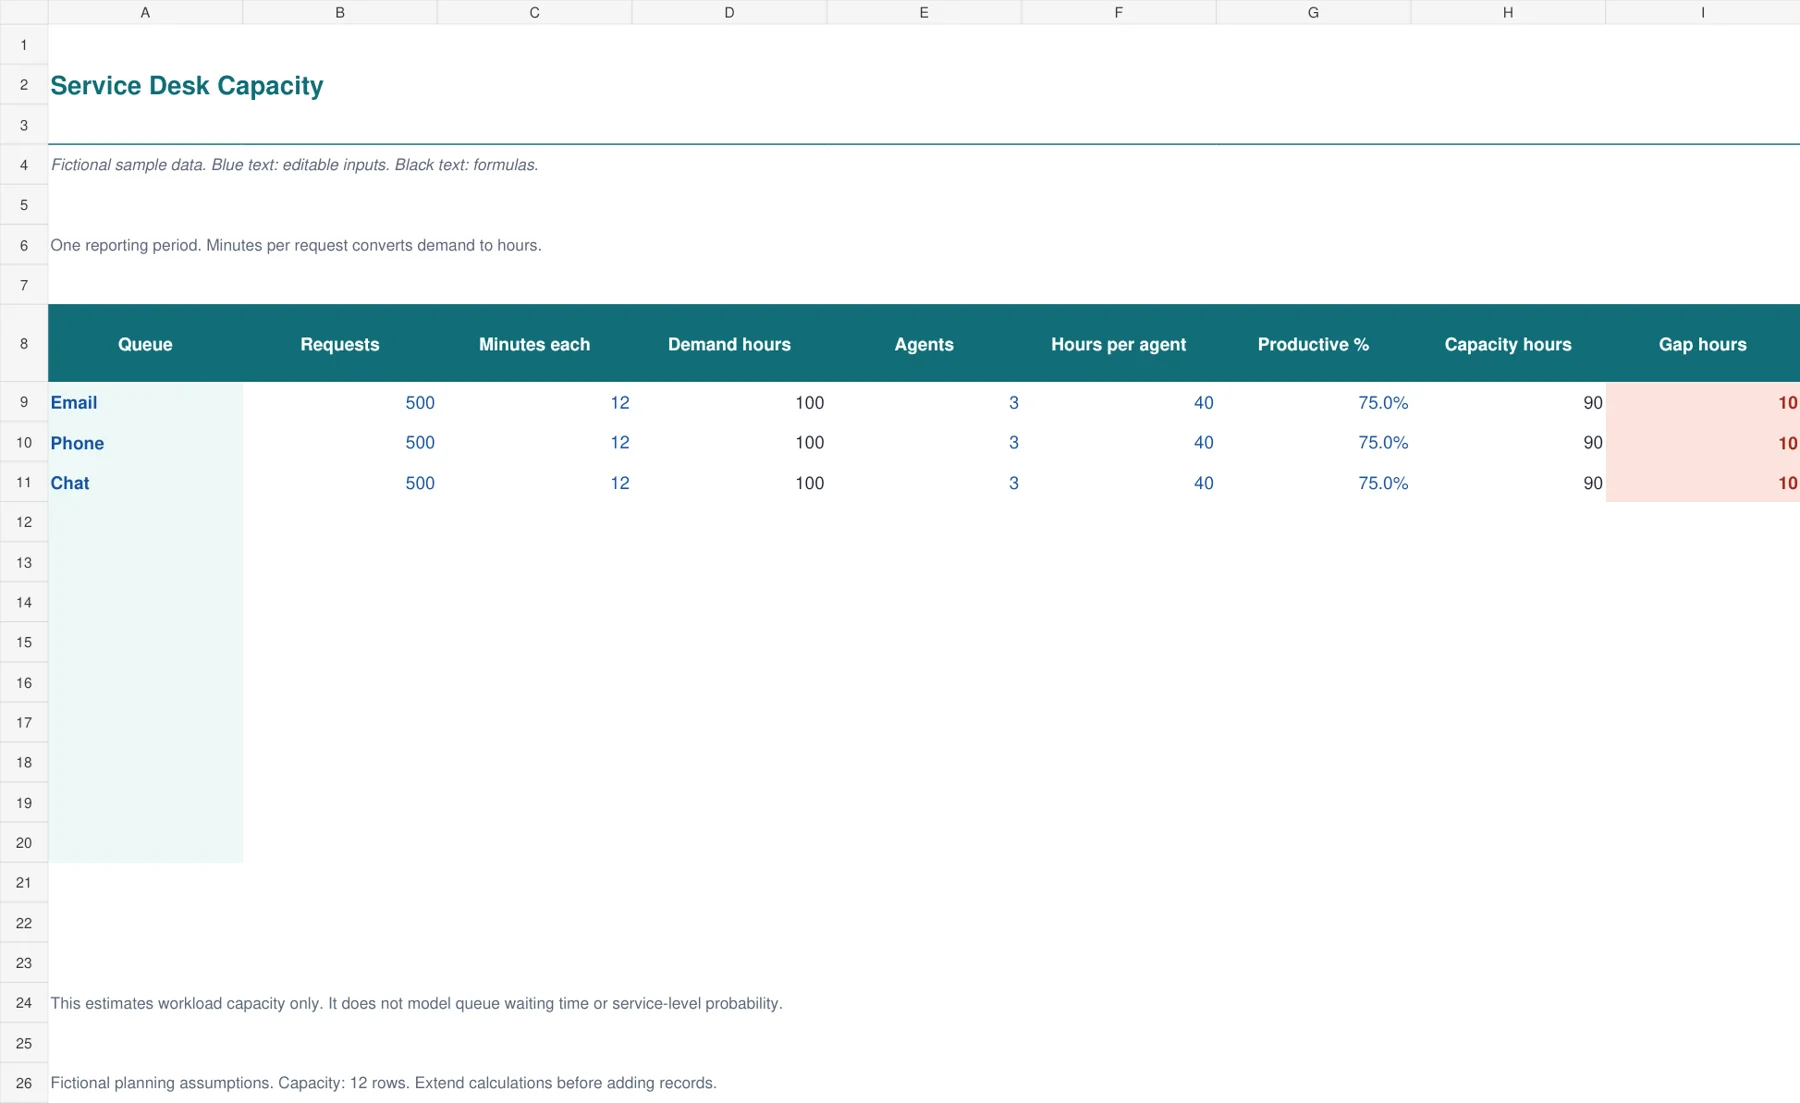
For a support queue, 500 requests at twelve minutes each create 100 hours of demand. Three agents with 40 hours each and a productive percentage of 75% provide 90 hours. The ten-hour shortage could be addressed by reducing avoidable requests, improving handling time, moving work or adding capacity. The workbook shows the size of the issue, while the manager chooses the appropriate response.
Choose and download your Excel template
1. Weekly Team Capacity
The navy weekly planner starts with each person’s contracted hours, subtracts leave and administration, and compares the result with assigned work. Remaining hours and utilization calculate beside the inputs. This makes it useful for a team leader who needs to spot overload before promising another task. Alternating rows help you follow one person across the table without a separate chart or oversized dashboard.
Use one week for the entire sheet. Enter realistic leave and administration allowances, then add the assigned workload in hours. A negative remainder highlights an overloaded person. Utilization is assigned hours divided by available hours. When availability is zero, the result displays n.a. rather than producing a division error or suggesting that the person can accept more work.
2. Project Role Capacity
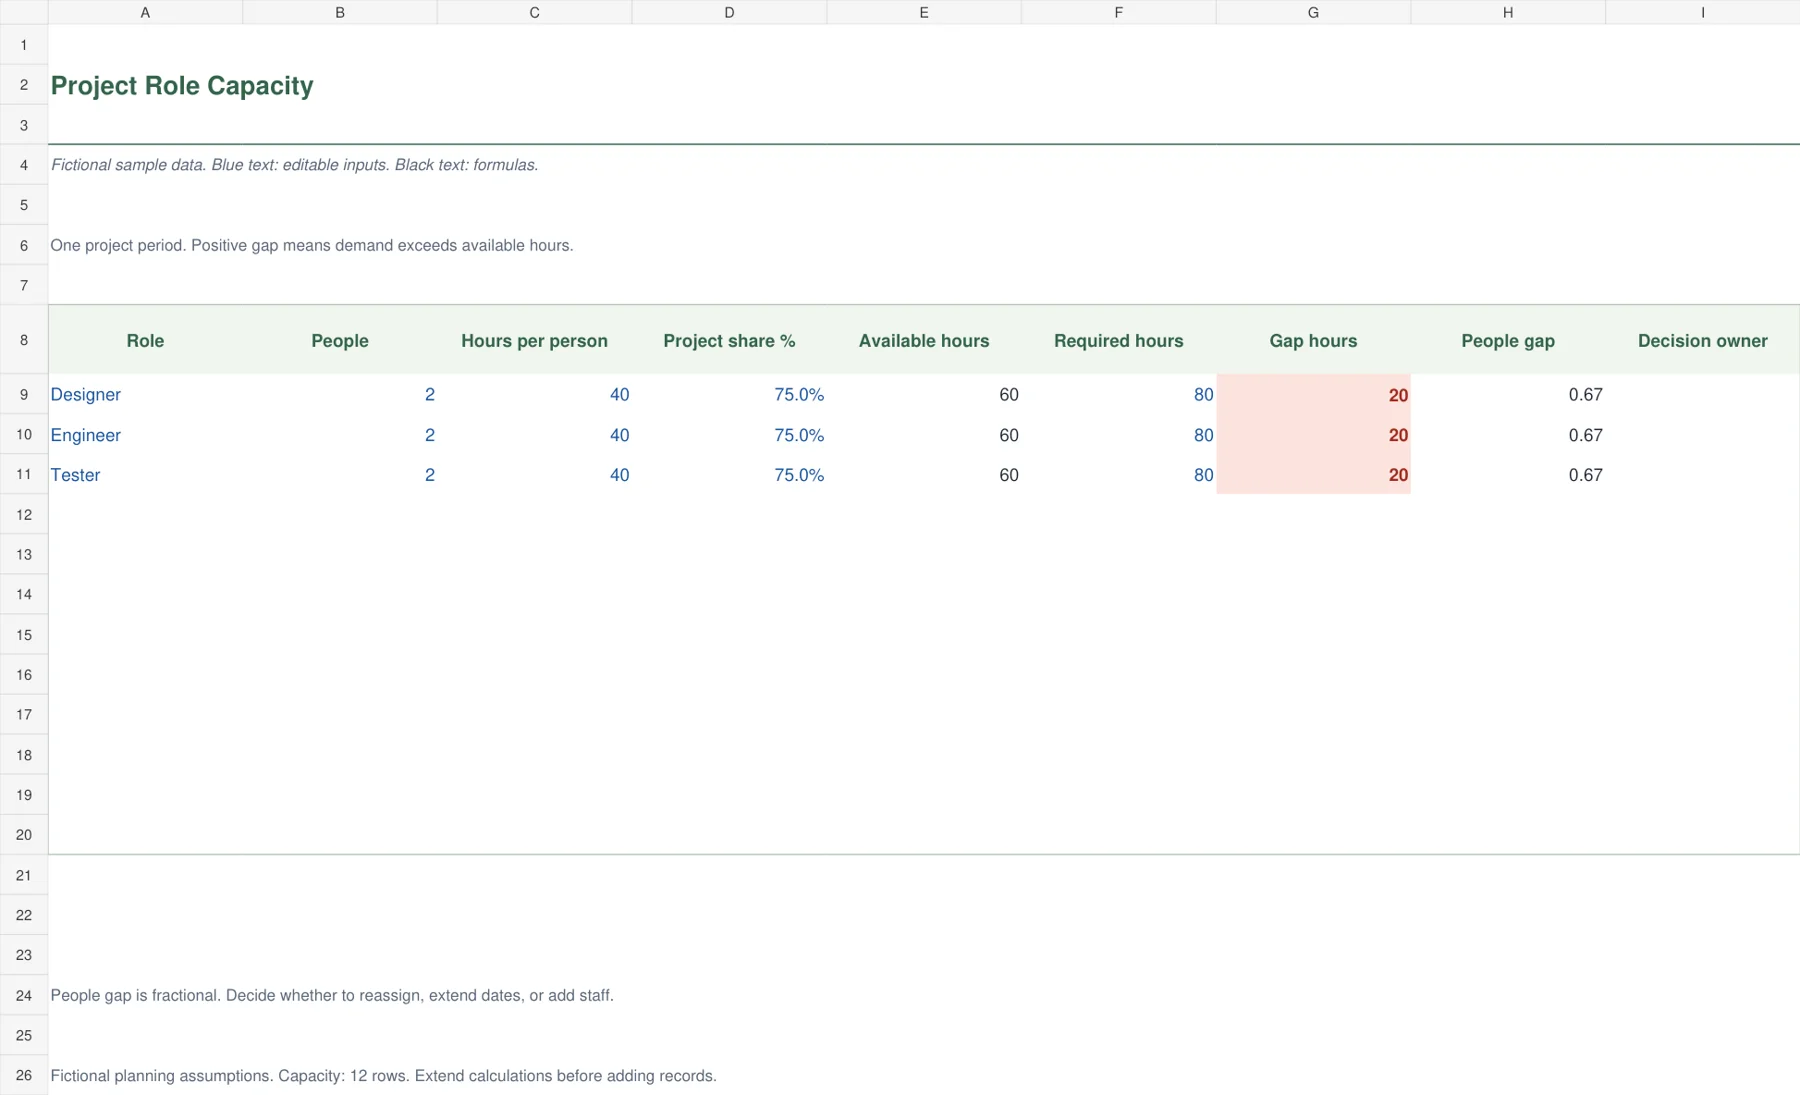
The green role-based sheet compares a project’s required hours with the capacity available from designers, engineers, testers or other roles. People, hours per person and the share allocated to this project determine available hours. The result includes the shortfall and a fractional people gap. This is useful when headcount exists on paper but only part of that time can be assigned to your project.
Set the period before entering values. If two designers each have 40 hours and can spend 75% on the project, they provide 60 hours. A requirement of 80 creates a 20-hour gap. The fractional people figure explains the scale of the shortage, but the manager still decides whether to reassign hours, move a milestone or add an appropriately skilled person.
3. Sprint Availability Planner
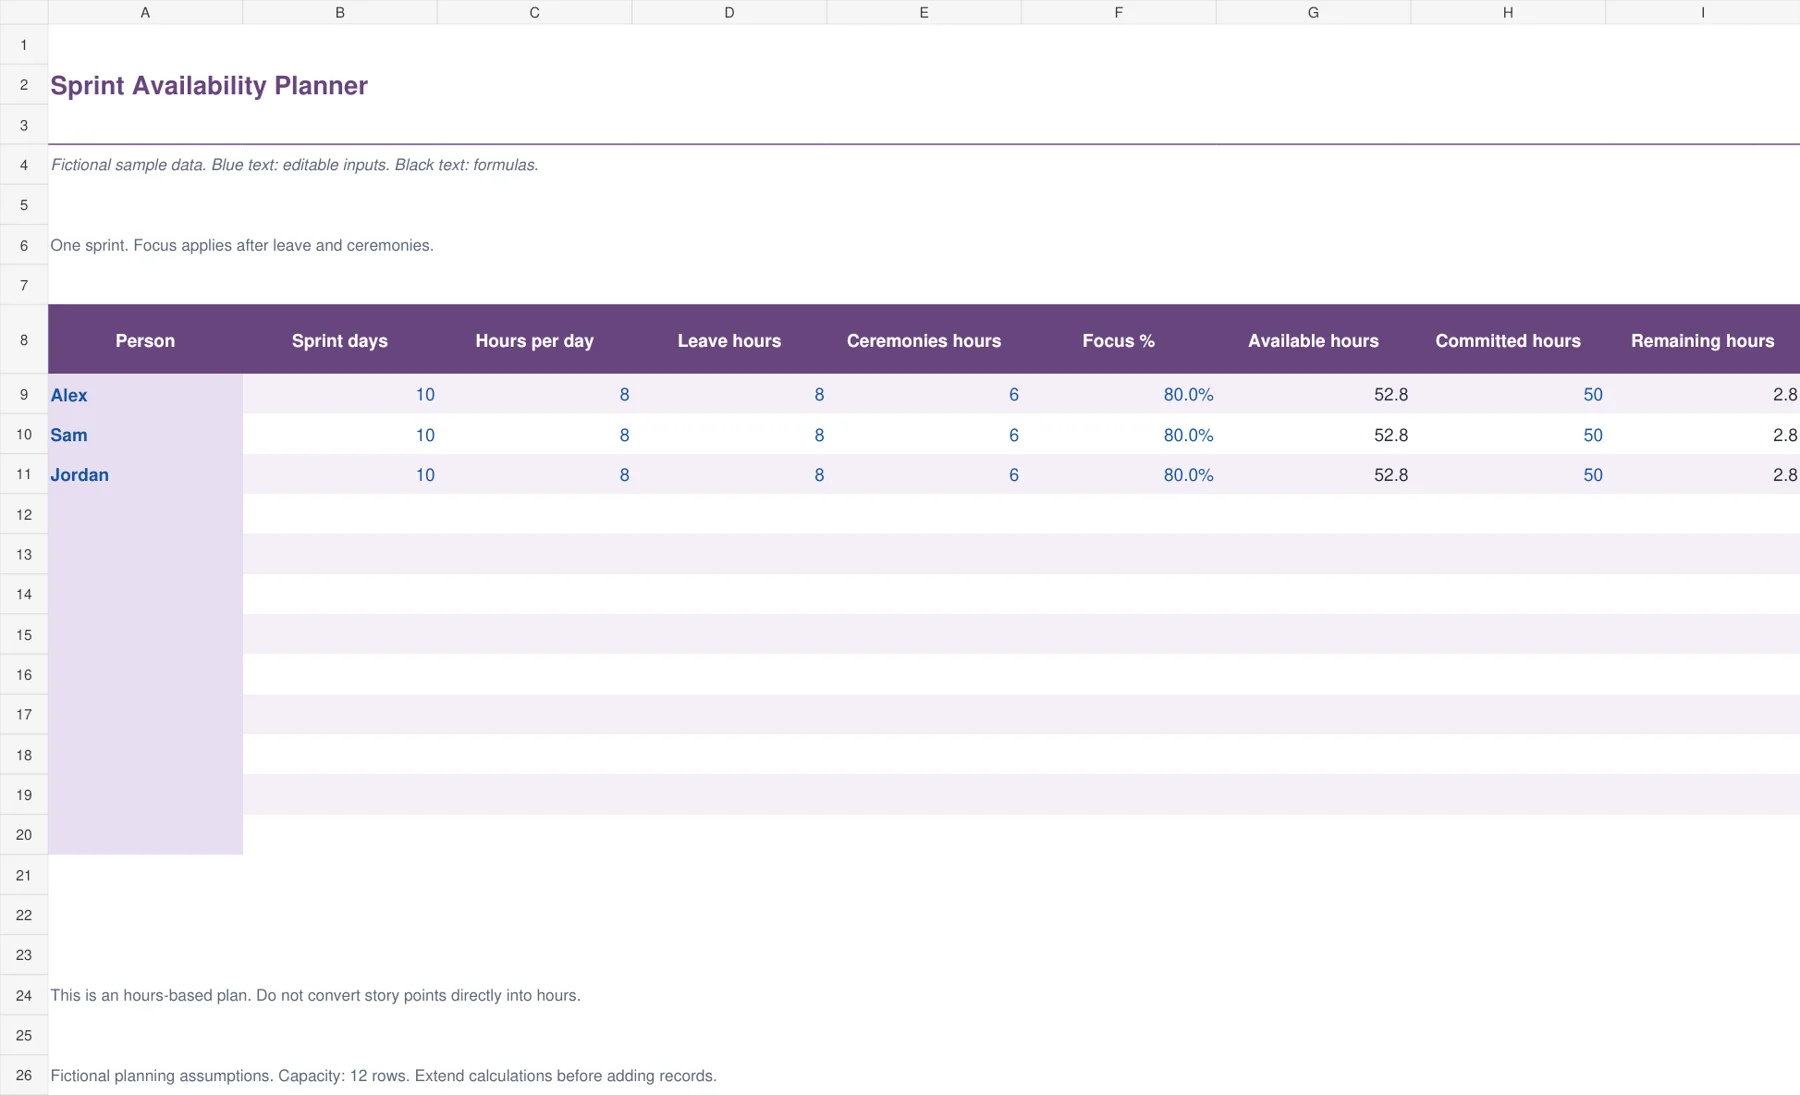
The purple sprint worksheet calculates availability from working days and hours per day, then subtracts leave and ceremonies before applying an editable focus percentage. Committed hours are compared with that result. This sequence makes the assumptions visible and keeps meeting allowances from being hidden inside an unexplained total. It supports an hours-based sprint planning discussion rather than converting story points into staff hours.
Enter the sprint length and actual absences for each person. Ceremonies represent time reserved for recurring team events. Focus percentage applies to the remaining time, so avoid subtracting the same allowance twice. Review a negative remainder before finalizing the sprint commitment. Compare the plan with actual experience afterward and adjust assumptions using evidence from your own team.
4. Monthly Hiring Capacity
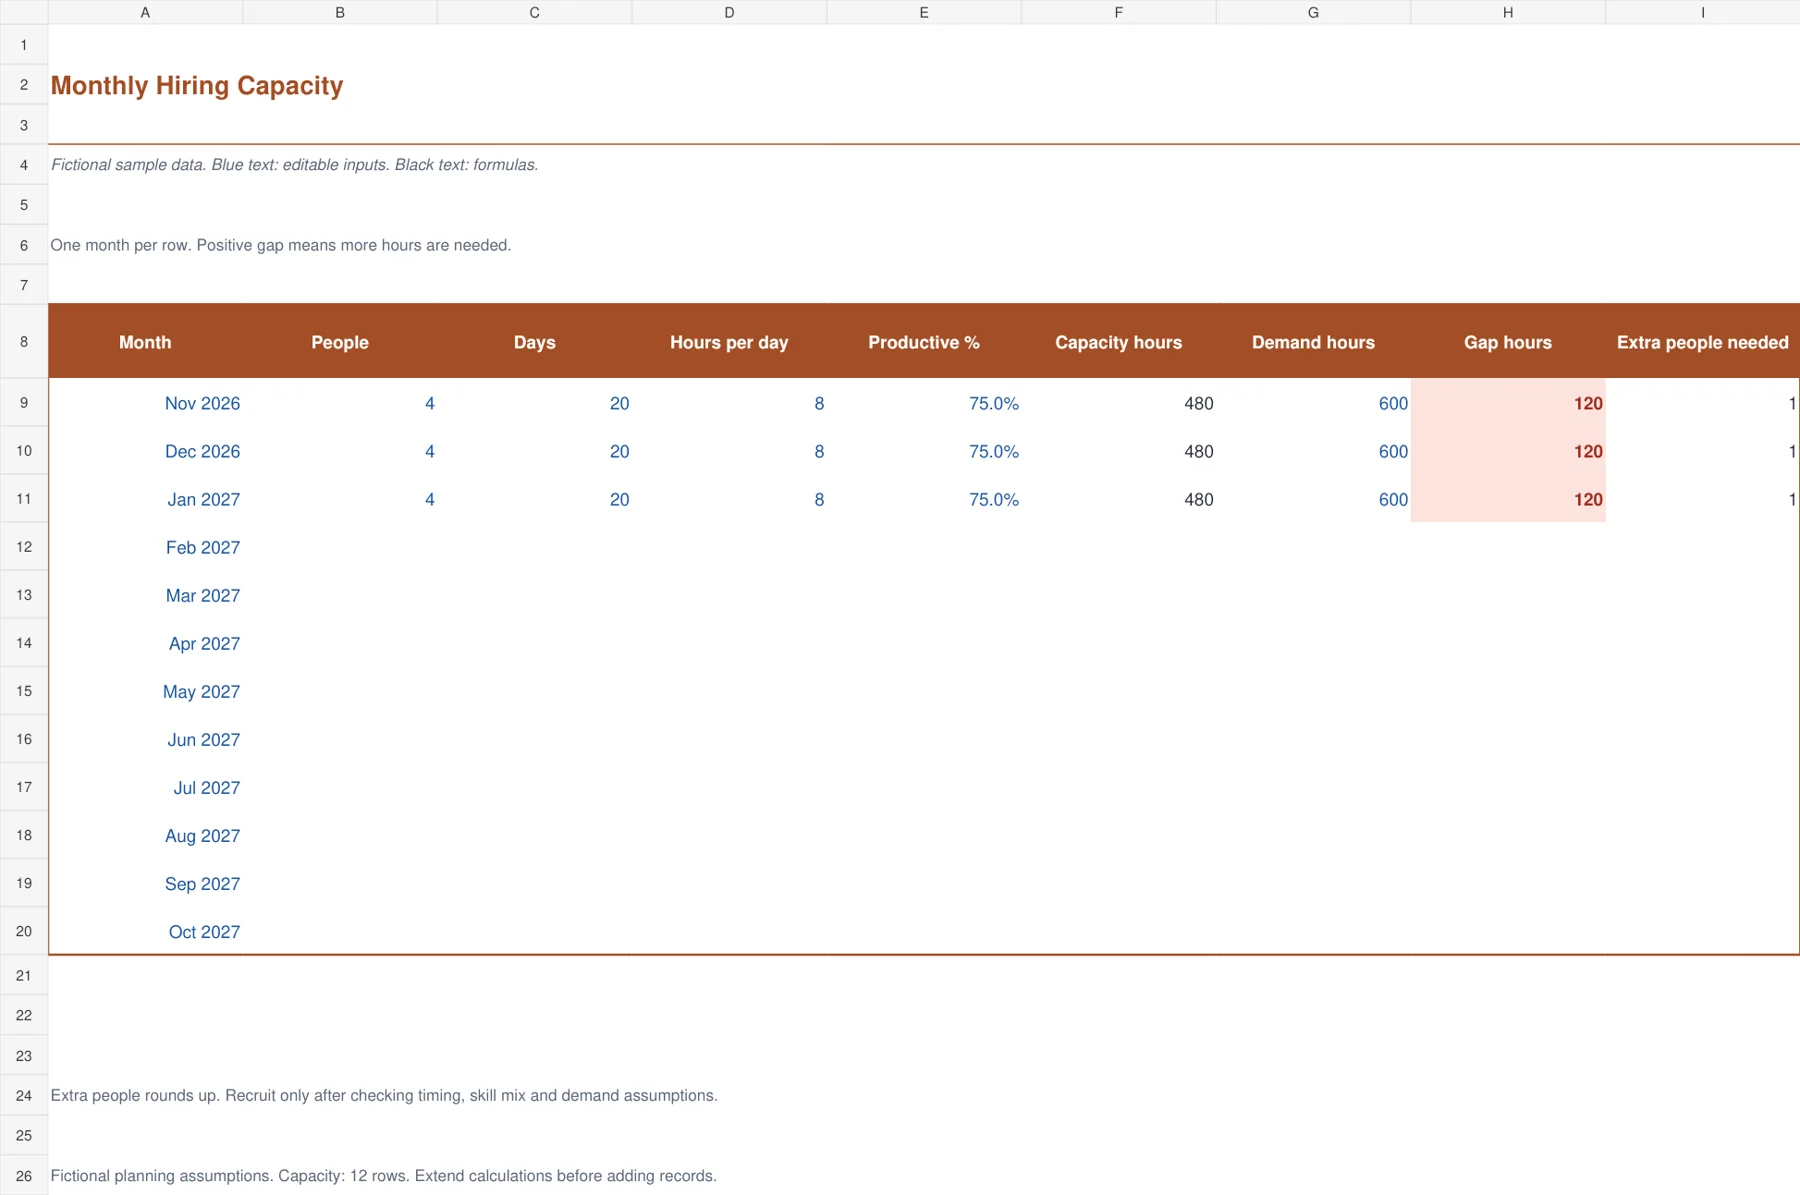
The orange monthly plan helps a manager compare expected demand with productive staff hours across a year. Headcount, working days, daily hours and productive percentage calculate monthly capacity. A demand gap is converted into additional whole people by rounding up. Each month remains an independent input row, allowing seasonality and working-day differences to be reflected instead of copying the same assumption through the year.
Enter the staff expected to be available in each month, then the demand hours for that period. A positive gap indicates a shortage. The additional-people result uses the productive hours one person would contribute in that same month. It estimates scale rather than a hiring instruction. Consider training time, start dates, skill requirements and whether the shortage will last before making a staffing decision.
5. Service Desk Capacity
The teal service worksheet translates request volume and average handling time into demand hours. It compares that workload with the productive capacity of the assigned agents. This suits an email queue, administrative processing team or small support desk that needs a transparent first estimate. The unit conversion is visible: requests multiplied by minutes per request, divided by 60 to obtain hours.
Use a consistent reporting period for requests and staff hours. Enter handling time from a representative sample, including the work you intend the team to perform. Productive percentage allows for time that is unavailable for request handling. A positive gap shows workload above capacity. This sheet does not estimate waiting-time probability, queue peaks or the staffing needed to guarantee a response-time target.
Turn the calculation into a usable team plan
Collect known leave and recurring commitments first. Use your employee vacation tracker to keep absences consistent with the capacity assumptions. Subtract only the allowances your model actually uses. For example, if a productive percentage already includes administration, subtracting administration again would understate available time.
Next, estimate demand at a level your team can maintain. A weekly plan does not need a separate row for every five-minute task. Group recurring work sensibly and retain detail for large or uncertain commitments. Discuss the estimate with the people doing the work, especially where an unfamiliar task or external dependency makes duration difficult to predict.
Compare capacity with demand before confirming dates. Move tasks only when their dependencies allow it, and record the owner of each decision. Your project timeline templates can show the delivery sequence while the capacity workbook tests whether the necessary staff hours are available in that period. A date on a timeline does not create the resources needed to meet it.
Publish the resulting allocation in a format the team can use. Pair the capacity review with a daily work schedule when attendance or coverage matters. Revisit the plan when a person becomes unavailable, a task grows or demand changes. Keep an agreed version so later changes can be explained without silently rewriting the original commitment.
Use percentages carefully
Productive percentage is an assumption about usable time. It should come from your work pattern, not an arbitrary target copied from another business. A desk with frequent interruptions may need a different allowance from a workshop with long uninterrupted tasks. Explain what the percentage includes and review it after comparing the plan with actual results.
A utilization figure above 100% indicates assigned work above calculated availability. It is a useful warning. A figure below 100% may reflect contingency, training or uneven demand rather than a problem. Avoid pushing every person to the same maximum percentage if doing so leaves no capacity for the uncertain work your team routinely receives.
The weekly and sprint sheets floor available time at zero when deductions exceed scheduled time. Such a result should prompt a review of the inputs. The hiring and role sheets display n.a. when the productive hours per person are zero, because a meaningful staffing ratio cannot be calculated from that denominator.
Adapt and maintain your workbook
The workbooks provide twelve rows for people, roles, queues or months. Extend the relevant formulas before adding records. Keep numeric inputs as numbers and percentages as percentage values, such as 75%, rather than typing words into calculation cells. Blue text identifies editable inputs and dark text identifies formulas. Save a clean master before customizing the layout.
For further planning approaches, see Smartsheet’s resource capacity planning guide. Start with a model your team can update reliably. A modest weekly review with current inputs is more useful than an elaborate plan that nobody maintains after the first meeting.
Frequently Asked Questions
Which template is best for a small team?
Use Weekly Team Capacity when you assign work to named people over one week. It compares scheduled hours, deductions and assigned workload directly. Choose Project Role Capacity if access to specific skills is the main constraint, or Monthly Hiring Capacity for a longer staffing discussion.
Can I plan an Agile sprint in hours?
Yes. The Sprint Availability Planner compares available hours with committed hours after leave, ceremonies and focus time. Keep story-point estimation as a separate team process. The workbook does not assume that one story point equals a fixed number of hours.
Does a positive gap always mean I should hire?
No. In the role, monthly and service sheets, a positive gap means demand exceeds the entered capacity. You might reduce scope, improve the process, redistribute suitable work or move timing. Consider whether demand is persistent and whether the required skills can be supplied before hiring.
Does the service-desk template guarantee response times?
No. It estimates total handling workload against productive staff hours. Queue peaks, arrival patterns, abandonment and response-time targets require a more detailed service model. Use this file to understand workload scale and the assumptions behind a first capacity estimate.
